Access a range of datasets and data tools to further your leaf area index research.
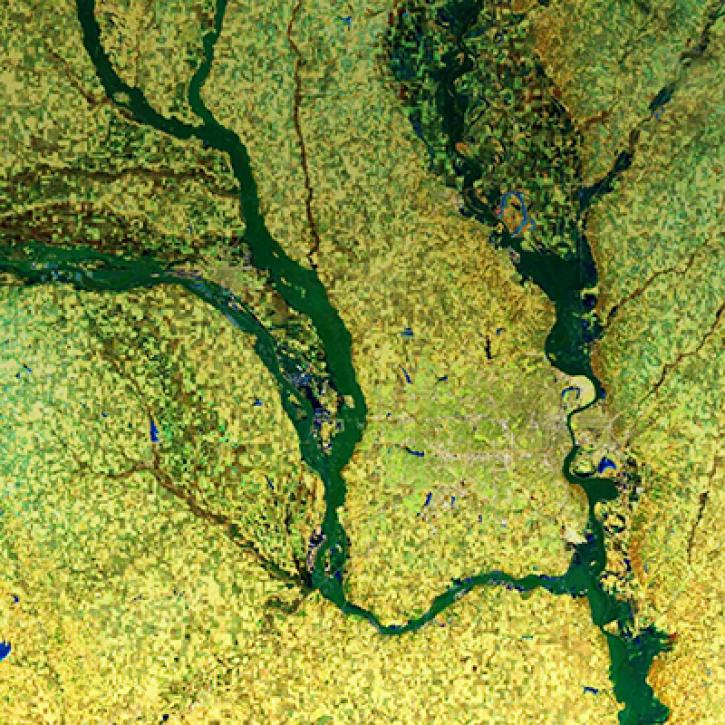
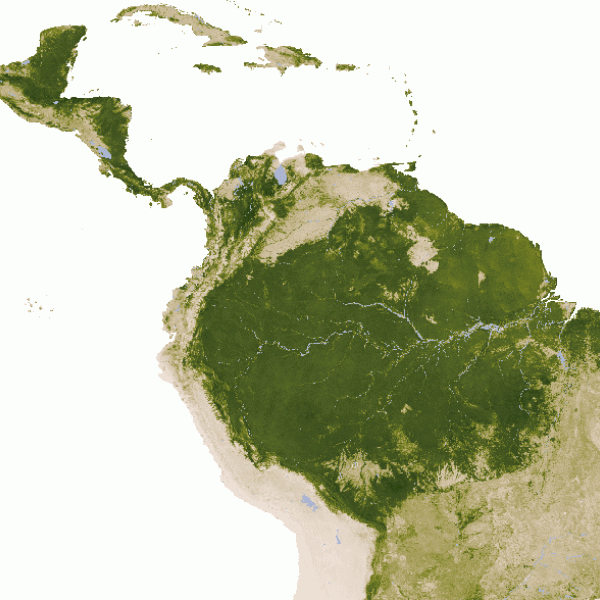
Leaf area index (LAI) is the amount of leaf area in an ecosystem. More specifically, LAI is the one-sided green leaf area per unit of ground area in broadleaf canopies or one-half of the total needle surface area per unit of ground area in coniferous canopies. Related to LAI is the fraction of absorbed photosynthetically active radiation (FAPAR) by green vegetation. Both measurements are used to calculate plant surface photosynthesis, evapotranspiration, and net primary production. In turn, the calculations are used in calculating vegetation terrestrial energy, carbon, water cycle processes, and biogeochemistry. In all, the data gives scientists essential information they need to evaluate vegetation stress, forecast agricultural yields, and other modeling and resource management applications.
Instruments aboard NASA satellites can broadly and relatively quickly survey the leaf area of ecosystems around the world, and subsequently, NASA has many datasets measuring LAI and FAPAR. A featured dataset is the MODIS Level 4 LAI product, which is a four-day composite dataset with 500-meter pixel size resolution. The product algorithm chooses the best pixel available from all acquisitions of the Moderate Resolution Imaging Spectroradiometers (MODIS) instruments aboard NASA’s Terra and Aqua satellites within a four-day period.
Learn How to Use Leaf Area Index Data


Join Our Community of NASA Data Users
While NASA data are openly available without restriction, an Earthdata Login is required to download data and to use some tools with full functionality.
Learn About the Benefits of Earthdata LoginFrequently Asked Questions
Earthdata Forum
Our online forum provides a space for users to browse thousands of FAQs about research needs, data, and data applications. You can also submit new questions for our experts to answer.
Submit Questions to Earthdata Forumand View Expert Responses
