Hurricanes are one of the largest hazards to life and property on Earth. Hurricanes are a rotating, tropical cyclone with a low pressure center (the eye) and 1-min average surface (10 m) winds in excess of 32 m s−1 (64 knots) in the Western Hemisphere. This area encompasses the North Atlantic Ocean, Caribbean Sea, Gulf of Mexico, and the eastern and central North Pacific east of the international date line.

Hurricanes are typically 124 to 311 miles (200 to 500 km) wide, but can grow to more than 600 miles (1,000 km) across. These massive storms can flood and damage areas with storm water surges, sustained high winds, and heavy rainfall. Over the past 50 years, hurricanes and tropical cyclones around the world have killed nearly 800,000 people and caused more than $1.4 trillion in economic damages.

NASA Earth-observing platforms provide data that can help in emergency preparedness before landfall and post-storm damage assessment and response. Examples of data these platforms can provide include precipitation rate, relative humidity, cloud and sea surface temperatures, and flooding maps. 

Get Hurricanes Data

Access a range of datasets and data tools to further your hurricanes research.

Learn How to Use Hurricanes Data

Access a range of webinars, tutorials, data recipes, and data stories to enhance your knowledge of Earth Observation data.
image of Earthdata graphic identifier design on top of data points
HS3 CPL Attenuated Total Backscatter Quick View
This data recipe instructs users on how to generate vertical time-height plots of Hurricane and Severe Storm Sentinel (HS3) Global Hawk Cloud Physics Lidar (CPL) attenuated total backscatter measurements using a Python plotting routine.
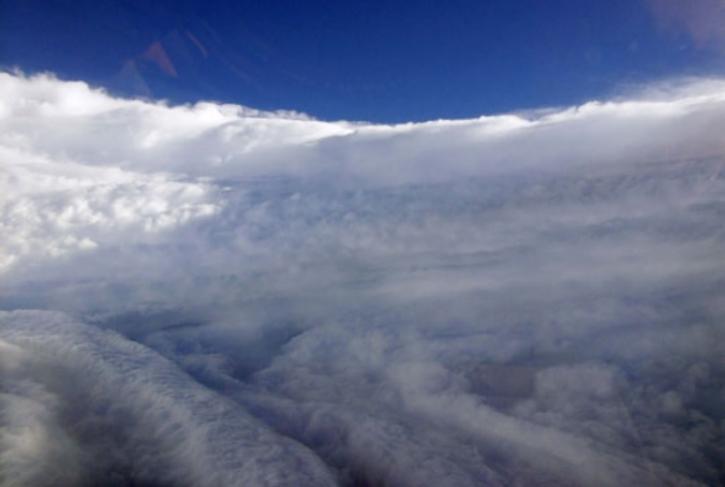
Hurricane Katrina eyewall
Data More Powerful than Hurricanes
New ways of looking at data help storm forecasters and emergency managers solve challenges and prevent hurricane losses.
Discover and Visualize Hurricanes Data
NASA data help us understand Earth's changing systems in more detail than ever before, and visualizations bring these data to life, making Earth science concepts accessible, beautiful, and impactful.
Data visualization is a powerful tool for analysis, trend and pattern recognition, and communication. Our resources help you find world-class data visualizations to complement and enhance your research. We also have tools and tutorials to help you translate hurricanes data into compelling visuals.
Image
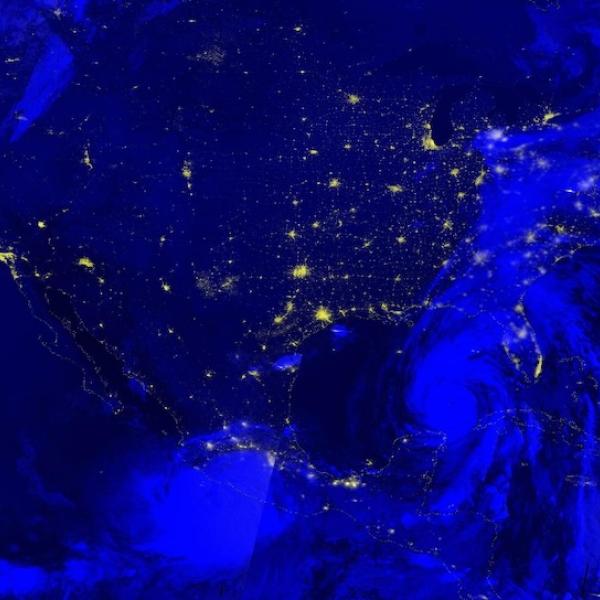
Nighttime image of Hurricanes John and Helene on 26 September 2024 from the VIIRS instrument aboard the joint NASA/NOAA NOAA-20 satellite
This image shows a nighttime view of Hurricanes John and Helene acquired on September 26, 2024, captured by the Visible Infrared Imaging Radiometer Suite (VIIRS) instrument aboard the joint NASA/NOAA NOAA-20 platform. Hurricane John can be seen skirting the western coast of Mexico and Hurricane Helene is fast approaching Florida from the Gulf of Mexico.

Join Our Community of NASA Data Users

While NASA data are openly available without restriction, an Earthdata Login is required to download data and to use some tools with full functionality.

Learn About the Benefits of Earthdata Login

Frequently Asked Questions

Earthdata Forum

Our online forum provides a space for users to browse thousands of FAQs about research needs, data, and data applications. You can also submit new questions for our experts to answer.

Submit Questions to Earthdata Forumand View Expert Responses

Earthdata
Forum