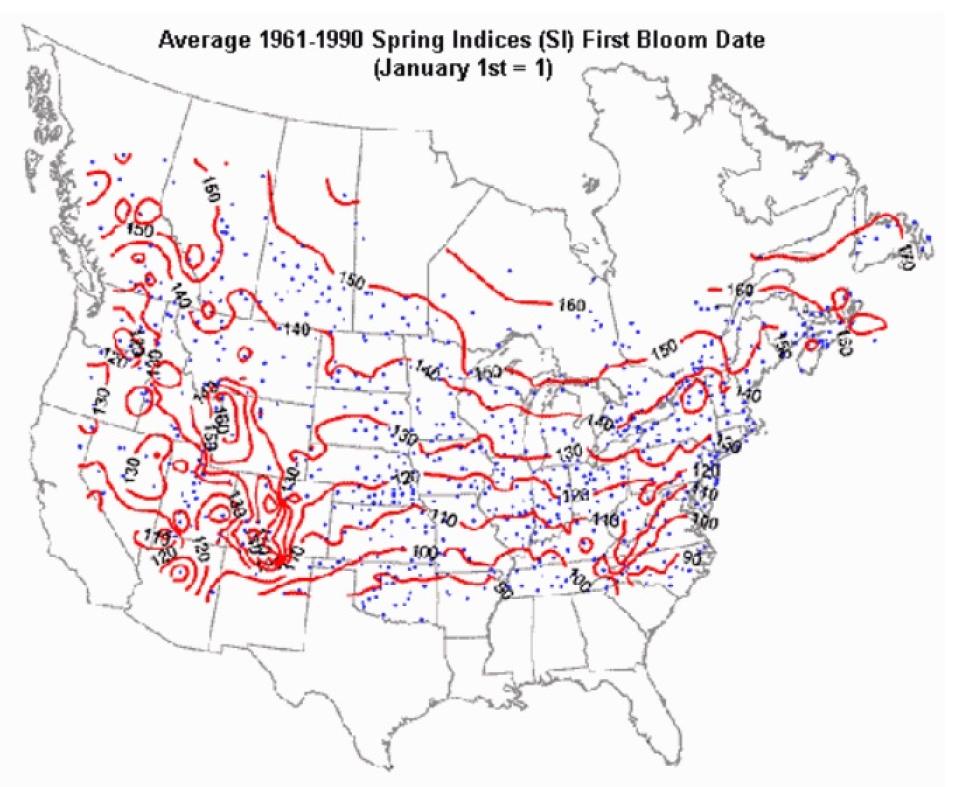
Understanding these dynamics requires distinguishing natural and local variability from more extensive and persistent climate change. "A phenology network will help us understand variability on a fine scale," Schwartz said. Remote sensing of plant phenology depends on interactions between vegetation, regional climate, soil, and microclimate, and all of these factors can vary across a study area. So researchers must be able to distinguish smaller-scale variability from larger-scale changes. "The ground data will help us understand spatial variability that results from differences in the responses of species and from differences in micro-environments," Schwartz said.
To get this simultaneously broad continental view and at the same time, local ground understanding of plant phenology, researchers face the task of relating satellite pixels to thousands of individual ground sites. To help scale this task down, NASA's Oak Ridge National Laboratory (ORNL) DAAC offers the MODIS subsetter, a tool that helps field study researchers work with MODIS vegetation data.
"The subsetted MODIS data helps us with the scale issues involved in a large study area," Schwartz said. "We need frequent data to track phenological events in spring, and over a wide area." Frequent, large volumes of data can be difficult and expensive to work with because of computing requirements and format. The MODIS subsetter allows researchers to pick out the MODIS data pixels that correspond exactly to field sites, and receive the data in either plain (ASCII) or geographically-coded (GeoTIFF) format. The ease of access, smaller data volume, and simple file format make large-scale studies such as a continent-wide ground phenology network more manageable and affordable.
Implementing the network
The idea of a "citizen scientist" network is not new. In the United States, Thomas Jefferson began recruiting volunteer weather observers in 1776. Today, under the direction of the National Weather Service, more than ten thousand volunteers record local temperature and precipitation data. "We are hoping to enlist some of those volunteer weather observers and so make use of a network that already exists," Schwartz said.
The implementation team chose lilacs as key phenology indicators for the NPN. "We based our approach on the experience of agricultural experiment stations of the 1950s and 1960s," Schwartz said. "They chose lilacs, because of their hardiness, broad distribution range, and distinct phenology. And people like receiving lilacs." Volunteers receive lilac plants cloned from cuttings, ensuring that they are genetically identical and will respond the same way to the environment. Lilacs will not grow everywhere, though, so observers may also select other indicator plants, or a plant from a list of natives. The volunteers choose a sunny location and nurture their lilac for one to two years before reporting first leaf and first bloom observations. The team hopes to develop a network of two thousand or more sites across the United States.
In the future, the volunteers may also record animal observations and signs of fall. Schwartz said, "Autumn phenological events have been poorly explored. The kinds of events that occur in autumn, related to first freeze or leaf drop, are often not as sharp." Researchers have been noticing changes in fall, and want to study more closely what they signal. Reed said, "For example, our colleagues in agriculture noticed that temperatures are remaining warmer longer than in the past, after winter wheat has germinated. Winter wheat germinates in late fall and remains dormant until spring. If its growing season is extended in autumn, it becomes more susceptible to pests, affecting yields."
Today, the USA National Phenology Network is growing, thanks to the committed efforts of many researchers who look forward to some day tapping this network for their research. "The development of NPN is totally grassroots," Reed said. "It's a multidisciplinary science effort, with researchers around the country all working for the same goal. The network will have many applications: knowing how to time agricultural activities, for example, or studying the human health effects of longer allergy seasons."
References
Schwartz, M. D., R. Ahas, and A. Aasa. 2006. Onset of spring starting earlier across the Northern Hemisphere. Global Change Biology 12: 343-351, doi: 10.1111/j.1365-2486.2005.01097.x
Schwartz, M. D., B. C Reed, and M. A White. 2002. Assessing satellite-derived start-of-season (SOS) measures in the conterminous USA. International Journal of Climatology 22(14): 1793-1805.
NOAA’s National Weather Service Cooperative Observer Program. Accessed September 19, 2006.
NOAA History: Cooperative Weather Observers. Accessed August 15, 2006.
For more information
NASA Land Processes Distributed Active Archive Center (LP DAAC)
NASA Oak Ridge National Laboratory DAAC (ORNL DAAC)
USA National Phenology Network
| About the remote sensing data used |
|---|
| Satellite | Terra/Aqua | |
| Sensor | Moderate Resolution Imaging Spectroradiometer (MODIS) | |
| Data sets | Leaf Area Index (MOD15A2) Vegetation Indices (MOD13) Land Cover Dynamics (MOD12Q2) | |
| Resolution | 250 meters, 500 meters, and 1 kilometer | |
| Parameters | Leaf Area Index (LAI) Fraction of Photosynthetically Active Radiation absorbed by vegetation (FPAR) Normalized difference vegetation index (NDVI) Enhanced vegetation index (EVI) Greenness (increase, maximum, decrease, minimum) | |
| DAACs | NASA Land Processes Distributed Active Archive Center (LP DAAC) NASA Oak Ridge National Laboratory DAAC (ORNL DAAC) | |


