Access datasets and data tools to further your research on ocean waves.
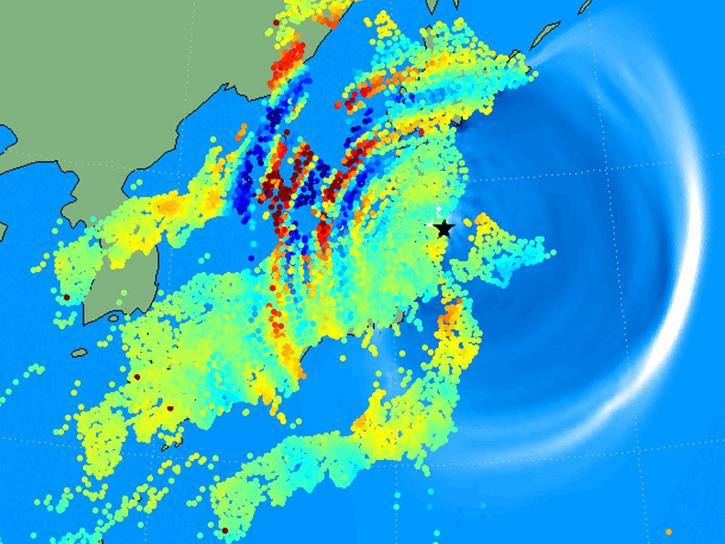
Ocean waves range from tiny wind-driven capillary waves to massive tsunamis caused by crustal movements. Between these extremes are Rossby waves—slow-moving, 10cm-high undulations that form over decades and influence major climate patterns like El Niño.
Both tsunamis and Rossby waves are challenging to detect: tsunamis remain undetectable until dangerously large, while Rossby waves are too small and slow-moving to identify easily.
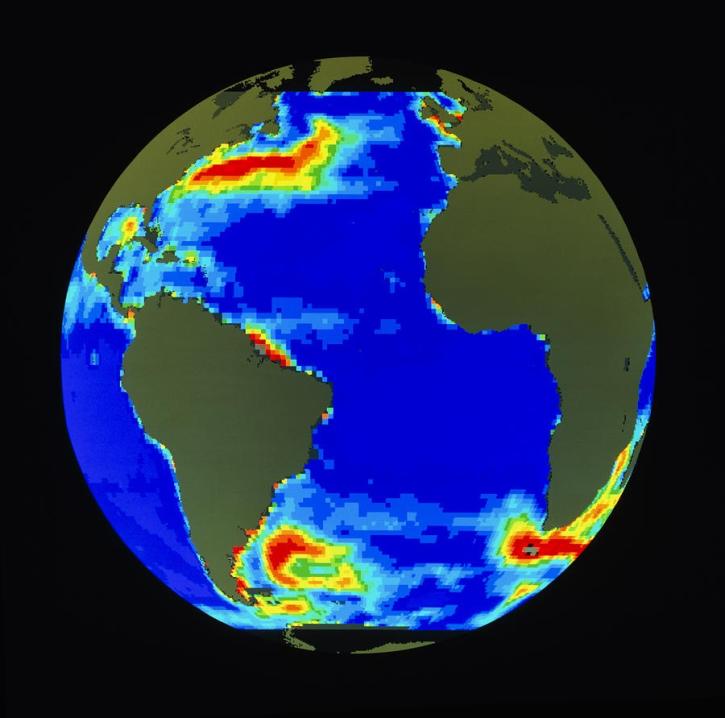
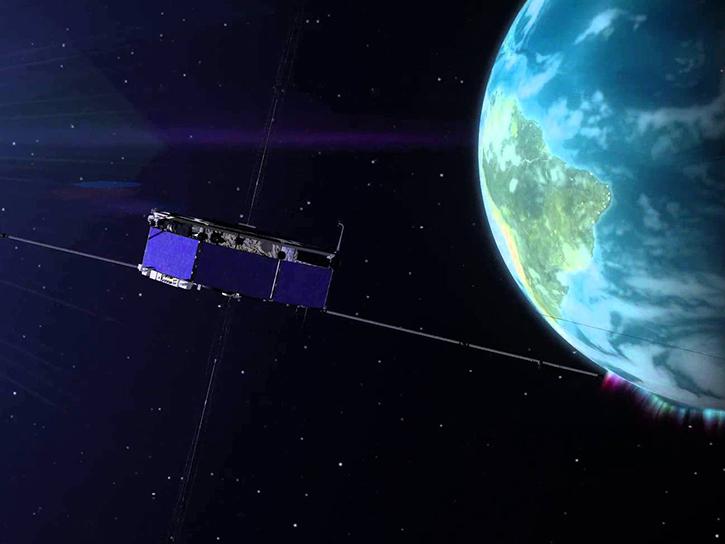
NASA's Surface Water and Ocean Topography (SWOT) mission addresses both challenges. SWOT uses radar pulses to measure ocean surface height with exceptional accuracy, detecting movements from tiny capillary waves to large-scale disturbances. The Jason satellite series, developed with the European Union, employs similar radar technology.
Combined with decades of satellite, buoy, and ship data, these missions provide comprehensive wave monitoring across multiple scales and timeframes. This detailed wave height data enables both tsunami detection and response, and helps scientists understand long-term climate and weather patterns.
Learn How to Use Ocean Waves Data


Join Our Community of NASA Data Users
While NASA data are openly available without restriction, an Earthdata Login is required to download data and to use some tools with full functionality.
Learn About the Benefits of Earthdata LoginFrequently Asked Questions
Earthdata Forum
Our online forum provides a space for users to browse thousands of FAQs about research needs, data, and data applications. You can also submit new questions for our experts to answer.
Submit Questions to Earthdata Forumand View Expert Responses