Image

Vegetation is a primary component of terrestrial biodiversity, playing a critical role in the global energy budget and in many of our biogeochemical cycles. Maintaining species richness ensures the productivity and stability of ecosystem processes, making it critical to monitor vegetation health. Measurements include vegetation condition (e.g., greenness, water stress), vegetation types, canopy height, vertical structure of forests, habitat structure, delineation and conservation of protected areas, phenology, and biomass measurements of groups and individuals.
Vegetation indices measure the amount of green vegetation over a given area and can be used to assess vegetation health. A commonly-used vegetation index is the Normalized Difference Vegetation Index (NDVI), which uses the difference between near-infrared (NIR) and red reflectance divided by their sum. NDVI values range from -1 to 1. Low values of NDVI generally correspond to barren areas of rock, sand, exposed soils, or snow, while higher NDVI values indicate greener vegetation, including forests, croplands, and wetlands. The enhanced vegetation index (EVI) is another widely used vegetation index that minimizes canopy-soil variations and improves sensitivity over dense vegetation conditions.
Vegetation products from the Moderate Resolution Imaging Spectroradiometer (MODIS) instrument (on NASA's Aqua and Terra satellites) and the Visible Infrared Imaging Radiometer Suite (VIIRS) instrument on the joint NASA/NOAA Suomi National Polar-orbiting Partnership (Suomi NPP) satellite can be accessed in various ways.
Research-quality data products can be accessed directly via Earthdata Search or NASA's Land Processes Distributed Active Archive Center (LP DAAC) Data Pool; datasets are available in HDF format but are, in some cases, customizable to GeoTIFF.
- Terra MODIS Vegetation Indices from Earthdata Search
- Aqua MODIS Vegetation Indices from Earthdata Search
- VIIRS Vegetation Indices from Earthdata Search
LP DAAC's Application for Extracting and Exploring Analysis Ready Samples (AppEEARS) offers a simple and effective way to extract, transform, visualize, and download MODIS and VIIRS vegetation-related data products. AppEEARS allows users to subset data by defining specific point(s) or area(s) of interest, and output data can be downloaded in csv (point), GeoTIFF (area) or NetCDF4 (area) format. Explore LP DAAC's Getting Started with Cloud-Native Harmonized Landsat Sentinel (HLS) Data in Python Jupyter Notebook for extracting an EVI Time Series from HLS.
NASA's Oak Ridge National Laboratory DAAC (ORNL DAAC) subsetting tools provide a means to simply and efficiently access and visualize MODIS and VIIRS vegetation-related data products as well.
Data products can be visualized as a time-averaged map, an animation, seasonal maps, scatter plots, or a time series through an online interactive tool, Giovanni. Follow these steps to plot data in Giovanni: 1) Select a map plot type. 2) Select a date range. Data are in multiple temporal coverages, so be sure to note the start and end date to ensure you access the desired dataset. 3) Check the box of the variable in the left column that you would like to include and then plot the data. For more information on choosing a type of plot, see the Giovanni User Manual.
- MODIS NDVI in Giovanni
Data can be downloaded as GeoTIFF.
Data can be visualized in Worldview:
- MODIS NDVI in Worldview
This dataset has a spatial resolution of 250 m and a temporal resolution of eight days. 16-day and monthly data are also available within Worldview. - MODIS EVI in Worldview
This dataset is monthly at 1 km spatial resolution. Rolling 8-day and 16-day data are also available within Worldview.
Image

Leaf Area Index (LAI) is the amount of leaf area in an ecosystem; more specifically, it is the one-sided green leaf area per unit ground area in broadleaf canopies and is one-half of the total needle surface area per unit ground area in coniferous canopies. FPAR is the fraction of photosynthetically active radiation (400-700 nm) absorbed by green vegetation. Both of these measurements are used for calculating surface photosynthesis, evapotranspiration, and net primary production, which in turn are used to calculate terrestrial energy, carbon, water cycle processes, and biogeochemistry of vegetation.
The MODIS Level 4 LAI product is a 4-day composite data set with 500 meter pixel size. The product algorithm chooses the best pixel available from all acquisitions of the MODIS sensors located on both NASA’s Terra and Aqua satellites from within a 4-day period.
- Terra MODIS LAI/FPAR from Earthdata Search
- Aqua MODIS LAI/FPAR from Earthdata Search
- Combined Terra/Aqua MODIS LAI/FPAR from Earthdata Search
- MODIS LAI in Worldview
LP DAAC's AppEEARS offers a simple and effective way to extract, transform, visualize, and download MODIS and VIIRS vegetation-related data products. AppEEARS allows users to subset data by defining specific point(s) or area(s) of interest, and output data can be downloaded in csv (point), GeoTIFF (area) or NetCDF4 (area) format.
ORNL DAAC's subsetting tools also provide a means to simply and efficiently access and visualize MODIS and VIIRS LAI and FPAR data products.
Image

Gross primary productivity (GPP) is the total energy captured by vegetation. Net primary productivity (NPP) is how much carbon dioxide (CO2) vegetation takes in during photosynthesis minus how much CO2 the plant releases during respiration. Values typically range from 0 to 6.5 grams per square meter per day. A negative value indicates decomposition or that respiration overpowered carbon absorption, i.e., more carbon was released to the atmosphere than the plants took in. Monitoring GPP and NPP is important as they form the basis of most ecosystem food webs.
The MODIS Level 4 GPP and NPP products are available in yearly and 8-day temporal resolutions with 1 km or 500 m pixel size.
- Terra MODIS Primary Productivity from Earthdata Search
- Aqua MODIS Primary Productivity from Earthdata Search
LP DAAC's AppEEARS offers a simple and effective way to extract, transform, visualize, and download MODIS and VIIRS vegetation-related data products. AppEEARS allows users to subset data by defining specific point(s) or area(s) of interest, and output data can be downloaded in CSV (point), GeoTIFF (area) or NetCDF4 (area) formats.
ORNL DAAC's subsetting tools also provide a means to simply and efficiently access and visualize MODIS and VIIRS GPP and NPP data products.
Image

Measurements of evapotranspiration (ET), the sum of evaporation from land surface and transpiration in vegetation, are extremely useful in monitoring and assessing water availability, drought conditions, and crop production. One of the challenges in acquiring ET data is that ET can’t be measured directly with satellite instruments as it is dependent on many other variables, such as land surface temperature, air temperature, and solar radiation. However, there are Level 4 data products (see data processing levels for more information) that incorporate daily meteorological reanalysis data with remote sensing data to arrive at estimations of ET. MODIS has such a product. Meteorological reanalysis data are assimilated products from historical atmospheric data from an extended period of time.
Research quality MODIS Level 4 ET products are available in yearly and 8-day temporal resolutions with 500 m pixel size.
Image

NASA's ECOsystem Spaceborne Thermal Radiometer Experiment on Space Station (ECOSTRESS) aboard the International Space Station (ISS) measures the temperature of plants to better understand how they respond to the stress of insufficient water availability. ECOSTRESS was launched in June 2018 and uses a multispectral thermal infrared radiometer to measure radiance, which is converted into surface temperature and emissivity. ECOSTRESS produces Level 3 ET data products according to the Priestly-Taylor Jet Propulsion Laboratory (PT-JPL) algorithm, using the surface temperature and emissivity as inputs (among other ancillary data inputs from other sources).
Research quality ECOSTRESS ET data products can be accessed directly via Earthdata Search or LP DAAC's Data Pool; datasets are available in HDF format but are, in some cases, customizable to GeoTIFF.
LP DAAC's AppEEARS offers a simple and effective way to extract, transform, visualize, and download MODIS and ECOSTRESS ET data products. AppEEARS allows users to subset data by defining specific point(s) or area(s) of interest, and output data can be downloaded in CSV (point), GeoTIFF (area) or NetCDF4 (area) format.
ORNL DAAC's subsetting tools also provide a means to simply and efficiently access and visualize MODIS ET data products.
The Land Data Assimilation System (LDAS) provides model-based ET data of which there is a global collection (GLDAS) and a North American collection (NLDAS). LDAS uses measurements of precipitation, soil texture, topography, and LAI to model soil moisture and evapotranspiration. When calculating ET, there are biases around seasonality or local-specific effects but developers try to account for those and calibrate accordingly; estimates of ET are provided every day and integrated to get monthly, seasonal, or annual information within 2-12% error.
GLDAS data products can be visualized as a time-averaged map, an animation, seasonal maps, scatter plots, or a time series through an online interactive tool, Giovanni. Follow these steps to plot data in Giovanni: 1) Select a map plot type. 2) Select a date range. Data are in multiple temporal resolutions and multiple temporal coverages, so be sure to note the start and end date to ensure you access the desired dataset. 3) Check the box of the variable in the left column that you would like to include and then plot the data. For more information on choosing a type of plot, see the Giovanni User Manual.
- GLDAS ET in Giovanni
Data are available with a temporal resolution of 3-hourly, daily, and monthly.
Image

ECOSTRESS also produces Level 4 evaporative stress index (ESI) and water use efficiency (WUE) products. The ESI product is derived from the ratio of Level 3 actual ET to potential ET (PET), calculated as part of an algorithm. WUE is the ratio of carbon stored by plants to water evaporated by plants. This ratio is given as grams of carbon stored per kilogram of water evaporated, over the course of the day from sunrise to sunset, on the day when the ECOSTRESS granule is acquired. ESI applications include indicating agricultural drought and observing vegetation stress.
LP DAAC's AppEEARS offers a simple and effective way to extract, transform, visualize, and download ECOSTRESS L1-L4 data products.
Image

Ice, Cloud and land Elevation Satellite-2
NASA's Ice, Cloud and land Elevation Satellite-2 (ICESat-2) satellite carries a single instrument, the Advanced Topographic Laser Altimeter System (ATLAS). ATLAS measures the travel time of laser pulses to calculate the distance between the spacecraft and Earth’s surface. While other satellites such as Landsat and MODIS allow researchers to study the location and extent of forests, ICESat-2 will allow them to study forest height. Because ATLAS is sensitive enough to detect individual photons, and has such a rapid firing rate, the instrument will be able to detect both the forest floor and the tops of canopies in all but the densest woods and jungles.
Research quality ATLAS data products can be accessed directly via Earthdata Search:
Visualizations of ATLAS data can be accessed through OpenAltimetry. OpenAltimetry is a cyberinfrastructure platform for discovery, access, and visualization of data from the ICESat and ICESat-2 missions:
- ATLAS Altimetry Data from OpenAltimetry
Note: you will need to zoom in until the tracks appear and then zoom in even further to access data products available for download.
Global Ecosystem Dynamics Investigation (GEDI)
The GEDI instrument makes precise measurements of forest canopy height, vertical canopy structure, and surface elevation, using high-resolution laser-ranging observations of the 3D structure of the Earth. GEDI data provide critical information on vegetation biomass, which is important to our understanding of how much carbon is stored by vegetation. In addition, these data provide characterization of habitat quality for many organisms. The instrument was deployed in December 2018 and is attached to the ISS.
In January 2020, GEDI mission researchers released the first measurements of forests around the world.
Image

Research quality GEDI data products can be accessed directly via Earthdata Search
- GEDI Elevation and Height Metrics Data from Earthdata Search
- GEDI Canopy Cover and Vertical Profile Metrics Data from Earthdata Search
- GEDI Geolocated Waveform Data from Earthdata Search
Also ORNL DAAC has Tutorials on GEDI Science Data Products, which demonstrate how to discover, access and use GEDI science data products archived at the ORNL DAAC.
Synthetic Aperture Radar (SAR)
SAR datasets provide a unique perspective for monitoring forest changes. SAR instruments are able to penetrate cloud cover and work in both day and night conditions. In addition, SAR, operating in the microwave portion of the electromagnetic spectrum, captures different target parameters than optical sensors, therefore providing unique information that complements standard optical remote sensing methods. For information on SAR, view What is Synthetic Aperture Radar?
With optical sensors, the returned signal is an indication of the chlorophyll concentration of a leaf. Using microwave sensors, the returned signal is proportional to the size, shape, and water content of the leaf. Therefore, SAR is sensitive to forest structure and biomass (adapted from the SAR Handbook, 2019).
Research quality (higher-level “standard”) SAR data products can be accessed via Earthdata Search or through NASA partner websites. For more information on choosing a dataset, refer to the Tools for Data Access and Visualization section.
- Sentinel-1A and Sentinel-1B SAR data from Earthdata Search
Note: Sentinel-1 operates at C-band and data are available in single or dual polarization. Another option for SAR data is the inclusion of phase information. Level 1 data are produced as single look complex (SLC), in which the phase information is preserved, or as ground-range detected (GRD), in which the phase information is lost. GRD data are appropriate for forest mapping and change detection. - Sentinel-1A and Sentinel-1B SAR data from Vertex
Vertex is NASA's Alaska Satellite Facility DAAC (ASF DAAC) search tool, which allows for the preview of numerous types of SAR data, including Sentinel-1. - UAVSAR from Earthdata Search
Uninhabited Aerial Vehicle Synthetic Aperture Radar (UAVSAR) is an airborne SAR instrument operating at L-band. Missions over portions of North America, Greenland, Iceland, and North, Central, and South America were conducted from 2008 to present. - UAVSAR from Vertex
- ALOS PALSAR from Earthdata Search
From 2006-2011, the Phased Array type L-band Synthetic Aperture Radar (PALSAR), aboard the Advanced Land Observing Satellite-1 (ALOS) acquired data from multiple observation modes with varying polarizations and resolutions. - ALOS PALSAR from Vertex
Radiometrically terrain corrected (RTC) data are available in GeoTIFF format.
To learn more about SAR and processing Level 1 data, view NASA's Applied Remote Sensing Training (ARSET) Introduction to SAR training or read the SERVIR SAR Handbook.
Image

Aboveground biomass (AGB) is organic material from plants and animals above the soil, including stems, branches, foliage, etc. Measures of AGB provide a baseline for monitoring carbon flux from land use change, forest degradation, and forest regrowth.
ORNL DAAC provides access to numerous AGB datasets as well as vegetation and forest datasets from various regions around the world, some of which can be downloaded in GIS analysis ready formats.
Research quality AGB data products can be accessed directly via Earthdata Search or from ORNL DAAC.
Specifically, at ORNL DAAC there are new maps which combine remotely sensed biomass data for different land cover types into harmonized global maps of above and belowground biomass. For information, read Mapping Carbon Beyond Forests. For geospatial data, see the Spatial Data Access Tool (SDAT) in the Tools for Data Access and Visualization section.
Ocean color remote sensing uses remote-sensing reflectance, which is based on the properties of the materials in the water. When light interacts with water, it can be absorbed or scattered. Light is absorbed by a combination of phytoplankton, non-algal properties, colored dissolved organic matter, and water itself. The Water Quality Data Pathfinder provides information on chlorophyll concentration and ocean color data.
Biodiversity is the abundance and variety of life found on Earth. It is important as it promotes ecosystem productivity, as well as the sustainability of life in general. A thriving, diverse ecosystem provides many benefits to humans. These ”ecosystem services” include nutrient storage and recycling, pollution filtration, water resource maintenance, and many others. Diverse ecosystems also provide many biological resources, such as food and medicines.
In a report from the United Nations Intergovernmental Science-Policy Platform on Biodiversity and Ecosystem Services (UN IPBES), researchers found an almost 20% decline in the average abundance of native species, as well as a sharp increase in the number of species now declared threatened. Thus monitoring biodiversity is critical. However, measuring biodiversity using field sampling can be costly and time-consuming and provides patchy information. Remote sensing data can fill in those gaps. When coupled with in-situ data, remote sensing data is critical for scientists and decision makers to make informed decisions. For more information on these statistics, read the UN IPBES Summary.
Image

“Hyperspectral” remote sensing (also known as “imaging spectroscopy”) is a uniquely powerful technique for mapping and studying biodiversity. Like most optical remote sensing, it is based on the fact that different chemical compounds interact with light in different ways. For example, chlorophyll, the plant pigment responsible for light absorption in plants, strongly absorbs red and blue light but reflects green light. This allows us to estimate the chlorophyll content of a leaf by measuring how much red, green, and blue light is reflected. Other plant compounds have their own spectral signatures, and different plant species have different combinations of these compounds and therefore different spectral signatures. Numerous databases exist listing spectral signatures of plants and other natural surfaces, including the Ecological Spectral Information System (EcoSIS), the ECOsystem Spaceborne Thermal Radiometer Experiment on Space Station (ECOSTRESS) Spectral Library, and the Ecological Spectral Model Library (EcoSML).
All optical remote sensing of vegetation is based in some part on the ability to distinguish between spectral signatures of different plants—however, what distinguishes hyperspectral remote sensing is its large number of bands in narrow wavelength increments. For example, where Landsat 8 has just 3 bands in the visible range (red, green, and blue), a hyperspectral instrument might have 30 to over 300 (For more information on spectral resolution, read What is Remote Sensing?). Therefore, where Landsat and similar “multispectral” instruments can see only general land-cover classes, hyperspectral instruments can map individual species, making them an invaluable tool for studying habitat diversity.
Hyperspectral measures of leaf-surface attributes during different seasons can yield useful information about ecosystem functioning, change, and evolution. When analyzed together with other remotely derived indices (e.g., leaf area index or fraction absorbed photosynthetically active radiation) and assimilated into models that include soil-related parameters, hyperspectral data offer the potential to observe patterns of species diversity (from Turner, 2003).
NASA’s Airborne Visible/InfraRed Imaging Spectrometer (AVIRIS) and AVIRIS Next Generation (AVIRIS-NG) are unique optical sensors that deliver calibrated images of the spectral radiance received by the sensor in 224 contiguous spectral channels with wavelengths from around 400 to 2500 nanometers (nm). AVIRIS has been flown on four aircraft platforms. To see flight paths from 2006-2019, with accessible data, visit the AVIRIS Data Portal. AVIRIS-NG has been flown on three different platforms. To see flight paths from 2014-2019, with accessible data, visit the AVIRIS-NG Data Portal.
Image

The Portable Remote Imaging Spectrometer (PRISM) comprises an imaging spectrometer covering the near-UV to near-IR range (350-1050 nm) and a separate spot radiometer covering two short wave infrared (SWIR) bands at 1240 and 1610 nm respectively. PRISM has been flown on several airborne platforms, specifically observing coastal zones. The PRISM Flight Locator Tool provides flight path information from 2014-2018.
The Hyperion instrument aboard NASA's Earth Observing-1 (EO-1) satellite detected 220 distinct wavelengths of light with a 30-meter resolution. The EO-1 satellite was launched on November 21, 2000 as part of a one-year technology validation/demonstration mission; however, the mission was extended due to interest from the remote sensing research and scientific communities. Data were collected through Data Acquisition Requests until 2017 when the satellite was decommissioned.
Research quality hyperspectral data products can be accessed directly via Earthdata Search. Datasets at Earthdata Search are site-specific.
- AVIRIS Hyperspectral Data from Earthdata Search
- PRISM Hyperspectral Data from Earthdata Search
- Hyperion Hyperspectral Data from Earthdata Search
The National Academies of Sciences, Engineering and Medicine chooses areas of priority for study called designated observables. The Surface Biology and Geology (SBG) Designated Observable, identified in the 2018 decadal survey "Thriving on Our Changing Planet: A Decadal Strategy for Earth Observation from Space,” has several observing priorities:
- Terrestrial vegetation physiology, functional traits, and health.
- Inland and coastal aquatic ecosystems physiology, functional traits, and health.
- Snow and ice accumulation, melting, and albedo.
- Active surface changes (eruptions, landslides, evolving landscapes, hazard risks).
- Effects of changing land use on surface energy, water, momentum, and C fluxes.
- Managing agriculture, natural habitats, water use/quality, and urban development.
SBG is currently in the initial phase of determining research and applications. For more information, view the SBG website.
Image

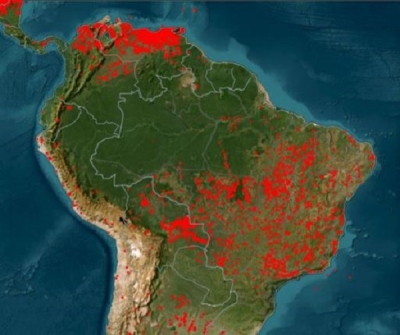
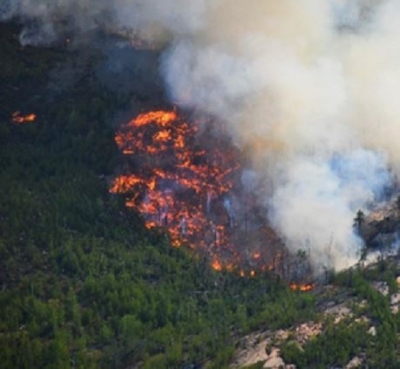
There are many causes of biodiversity loss, including deforestation, agricultural development, urbanization, pollution, and climate change. Understanding the ways in which humans are interacting with the environment, and how resulting changes impact Earth’s systems is important to preserving biodiversity.
Surface reflectance is useful for measuring the greenness of vegetation, which can then be used to determine phenological transition dates including start of season, peak period, and end of season. Moderate resolution instruments that are primarily used for this measurement include NASA's Moderate Resolution Imaging Spectroradiometer (MODIS) instrument aboard both the Terra and Aqua satellites and the Visible Infrared Imaging Radiometer Suite (VIIRS) aboard the joint NASA/NOAA Suomi National Polar-orbiting Partnership (Suomi NPP) satellite. MODIS reflectance products are available at 250 m, 500 m, 1000 m, and 5600 m spatial resolution. VIIRS reflectance products are available at 500 m and 1000 m spatial resolution. MODIS data are acquired every one to two days, whereas the wider swath width of VIIRS allows for daily global coverage.
The Advanced Spaceborne Thermal Emission and Reflection Radiometer (ASTER)—a cooperative effort between NASA and Japan's Ministry of Economy Trade and Industry—is another high-resolution instrument that acquires visible and near-infrared (VNIR) reflectance data at 15 m resolution and SWIR (through 2009) reflectance data at 30 m resolution. Note that ASTER is a tasked sensor, meaning that it only acquires data when it is directed to do so over specific targets, making its temporal resolution variable depending on your target region of interest. ASTER Surface Reflectance products are processed on-demand and so must be requested with additional parameters. Note that there is a limit to 2000 granules per order.
Research quality surface reflectance data products can be accessed directly via Earthdata Search or NASA's Land Processes Distributed Active Archive Center (LP DAAC) Data Pool; MODIS, VIIRS, and ASTER products are available in HDF format, but are also customizable to GeoTIFF:
- MODIS Surface Reflectance from Earthdata Search
- VIIRS Surface Reflectance from Earthdata Search
- ASTER Surface Reflectance from Earthdata Search
LP DAAC also provides a tool called the Application for Extracting and Exploring Analysis Ready Samples (AppEEARS). AppEEARS offers a simple and efficient way to access, transform, and visualize geospatial data from a variety of federal data archives. MODIS and VIIRS surface reflectance data are available in AppEEARS, as well as the USGS Landsat Analysis Ready Data (ARD) surface reflectance product. Other products useful for biodiversity applications available in AppEEARS include Daymet daily weather parameters, Soil Moisture Active Passive (SMAP) products, and MODIS snow cover products.
NASA's Oak Ridge National Laboratory DAAC (ORNL DAAC) also provides tools for on-demand subsetting of MODIS and VIIRS land data. In particular, the Subsets API allows users to retrieve custom subsets, analytics and visualization of MODIS and VIIRS data products.
For higher resolution, the Landsat 7 Enhanced Thematic Mapper (ETM+) sensor and the Landsat 8 Operational Land Imager (OLI) instrument acquire data at 30 m spatial resolution in VNIR every 16 days (or less as you move away from the equator). Landsat 8 was developed as a collaboration between NASA and the USGS. The USGS now leads satellite operations and data archiving at the Earth Resources Observation and Science (EROS) center.
Landsat data can be discovered using Earthdata Search, however, you will need a USGS Earth Explorer login to download the data.
- Landsat 8 Operational Land Imager from Earthdata Search
- Landsat 7 Enhanced Thematic Mapper Plus from Earthdata Search
Another high resolution option is the new (but currently provisional) Harmonized Landsat and Sentinel-2 (HLS) project, which provides consistent surface reflectance and top of atmosphere brightness data from the OLI aboard the joint NASA/USGS Landsat 8 satellite and the Multi-Spectral Instrument (MSI) aboard Europe’s Copernicus Sentinel-2A and Sentinel-2B satellites. The combined measurement enables global observations of the land every 2–3 days at 30-meter (m) spatial resolution. Explore the Getting Started with Cloud-Native HLS Data in Python Jupyter Notebook for extracting an EVI Time Series from HLS.
Data can be visualized in Worldview:
- MODIS True Color in Worldview
Note that Worldview does have a corrected reflectance product but it is not a standard, research quality product. The purpose of this algorithm is to provide natural-looking images by removing gross atmospheric effects, such as Rayleigh scattering, from MODIS visible bands 1-7. - HLS Surface Reflectance in Worldview
Image
, increased (purple), and stayed the same (white) between 2012 and 2016 in the Midwest.")
Nighttime lights can disrupt the natural behaviors of wildlife; hatching turtles will move toward an artificial light source rather than the natural light provided by the moon and nocturnal animals become less active as nighttime light levels increase. VIIRS nighttime imagery layer shows the Earth’s surface and atmosphere using a sensor designed to capture low-light emission sources, under varying illumination conditions, which can aid in our understanding of how nighttime lights affect animal behavior.
NASA has also developed Black Marble, a daily calibrated, corrected, and validated product suite, so nightlight data can be used effectively for scientific observations. Black Marble's standard science processing removes cloud-contaminated pixels and corrects for atmospheric, terrain, vegetation, snow, lunar, and stray light effects on the VIIRS Day/Night Band radiances. Black Marble data can be accessed at NASA's Level-1 and Atmosphere Archive and Distribution System DAAC (LAADS DAAC). Black Marble imagery in Worldview is an image composite that was assembled from clear, cloud free images for 2012 and 2016.
For more information on the VIIRS DNB and Black Marble products, view the Earthdata Nighttime Lights Backgrounder.
NASA's Socioeconomic Data and Applications Center (SEDAC) has various datasets that aid in the understanding of human impact on the Earth’s surface. Datasets and maps are grouped thematically under such topics as biodiversity, conservation and protected areas, agriculture, land use and land cover change, marine and coastal regions, population distribution and change, and urbanization.
SEDAC has several map-based tools to assess human impact on the environment. POPGRID Viewer enables direct comparison of different population datasets based on different data sources and methodologies.
Image

Image

Whether observing on the ground or from the air, it is almost impossible to count every member of a species. Because it is difficult to ascertain actual species distributions, another approach is to predict species distributions by identifying key environmental (i.e., abiotic) characteristics of suitable species habitats and then use models that incorporate both information on known occurrences of a species (i.e., presence data) along with certain environmental characteristics of those known habitats in which the species occurs to estimate potential habitats in locations where species occurrence data are lacking. In some cases, these models are augmented with information on known absences of a species, i.e., places where it is certain that the species of concern does not exist. The combination of presence and absence species occurrence data makes for even more powerful predictive models.
Species Distribution Models (SDMs) estimate the relationship between observed, in-situ species occurrences and the environmental and/or spatial characteristics of those locations. SDMs use raster-based layers such as land use/land cover, elevation, precipitation, temperature, and vegetation indices, as predictors of suitable habitats; this information is then combined with ground-collected presence data in statistical models to determine if a habitat is ideal for a particular species.
Numerous raster-based datasets (below) are available for model input. Note that, ideally, environmental data need to be in the same projection to get the most accurate results.
There is a wealth of species occurrence data available; in fact, the Global Biodiversity Information Facility (GBIF), an international network and research infrastructure funded by the world's governments and aimed at providing anyone, anywhere, open access to data about all types of life on Earth, has close to 1.5 billion occurrence records. Even so, spatial, temporal, and taxonomic gaps, as well as other limitations, mean that much more data are needed. For example, GBIF records represent roughly 60% of named species, and many of these species either do not have a sufficient number of observations, or the observations are not usable, to support SDMs. Researchers using SDMs filter the records carefully so that only those of sufficient quality are used in their models.
Recently, developments in in-situ data collection have changed the way ecologists can detect species. “Transmission tags on terrestrial and aquatic animals, camera traps, sound recording devices, remotely piloted drones, and collections of environmental DNA in fresh and salt waters and soils are directly observing organisms, even the microbial components of biodiversity.” (Turner, 2014).
A relatively new source of observations comes from citizen science. In particular, the smartphone application iNaturalist has led to a surge in contributed observations and now account for a large percentage of new species occurrence observations. These observations are vetted for quality by experts.
Some additional sources of NASA-supported in-situ data, categorized by variable, are shown below:
| Variable | Data Source | Repository |
|---|---|---|
| Distribution | Telemetry | Movebank |
| Acoustics | Wildlife Insights | |
| eDNA | USGS Aquatic Invasive Species eDNA Database - in Development Cal eDNA |
|
| Camera Trap | Wildlife Insights | |
| Field Observations | iNaturalist eBird Map Of Life |
|
| Movement | Mark-Recapture | Movebank |
| Telemetry | Movebank | |
| Biologger/Biotags | Movebank | |
| Camera Trap | Wildlife Insights | |
| Accelerometers | Movebank | |
| Abundance/Demographics | Acoustics | Wildlife Insights |
| Physiology | Accelerometers | Movebank |
| Photos/Field Spectrometers | EcoSIS |
NASA's Modern-Era Retrospective analysis for Research and Applications version 2 (MERRA-2) is an atmospheric reanalysis for the satellite era using NASA's Goddard Earth Observing System Model, Version 5 (GEOS-5) with its Atmospheric Data Assimilation System (ADAS). The MERRA project focuses on historical climate analyses for a broad range of weather and climate time scales and places the NASA suite of observations in a climate context. MERRA covers the period 1979–present, continuing as an ongoing climate analysis as resources allow. For more information on the various parameters in the land surface diagnostics product, see the Merra-2 File Specification.
Image
 land surface diagnostics data product.")
Research quality data products can be accessed directly from Earthdata Search or NASA's Goddard Earth Sciences Data and Information Services Center (GES DISC) Data Pool:
Data products can be visualized as a time-averaged map, an animation, seasonal maps, scatter plots, or a time series through an online interactive tool, Giovanni. Follow these steps to plot data in Giovanni: 1) Select a map plot type. 2) Select a date range. Data are in multiple temporal resolutions, so be sure to note the start and end date to ensure you access the desired dataset. 3) Check the box of the variable in the left column that you would like to include and then plot the data. For more information on choosing a type of plot, see the Giovanni User Manual.
Data can be visualized in Worldview:
The Terra and Aqua MODIS Land Cover Type data product provides global land cover types at yearly intervals, derived from six different classification schemes (the MODIS Land Cover User Guide provides additional information on those schemes). The product is derived using supervised classifications of MODIS Terra and Aqua reflectance data. The supervised classifications then undergo additional post-processing that incorporate prior knowledge and ancillary information to further refine specific classes.
The Terra and Aqua MODIS Land Cover Dynamics data product provides global land surface phenology metrics at yearly intervals from 2001 to 2017, derived from time series of the 2-band EVI (EVI2). Vegetation phenology metrics at 500 m spatial resolution are identified for up to two detected growing cycles per year.
The Terra MODIS Vegetation Continuous Fields (VCF) data product is a global representation of surface vegetation cover as gradations of three ground cover components: percent tree cover, percent non-tree cover, and percent non-vegetated (bare). VCF products provide a continuous, quantitative portrayal of land surface cover at 250 m pixel resolution.
NASA's Land Processes Distributed Active Archive Center (LP DAAC) Application for Extracting and Exploring Analysis Ready Samples (AppEEARS) offers the ability to extract subsets, transform, and visualize MODIS and VIIRS vegetation-related data products.
NASA's Oak Ridge National Laboratory DAAC (ORNL DAAC) subsetting tools provide a means to simply and efficiently access and visualize MODIS and VIIRS land cover types, phenology and VCF data products as well.
Image

Land surface temperature is useful for monitoring changes in weather and climate patterns which can impact the suitability of an area for a specific species to live and function.
Research quality land surface temperature data products can be accessed directly from Earthdata Search or LP DAAC's Data Pool; MODIS and ASTER data are available as HDF and VIIRS and ECOSTRESS are available as HDF5:
- Terra MODIS Land Surface Temperature from Earthdata Search
- Aqua MODIS Land Surface Temperature from Earthdata Search
For both of the MODIS products, select daily, 8-day, or monthly at 1 km or 5.6 km resolution. For more information on spatial and temporal resolution, view What is Remote Sensing? - Terra MODIS Land Surface Temperature/3-Band Emissivity
- Aqua MODIS Land Surface Temperature/3-Band Emissivity
For both of these MODIS products, select 5-min, daily and 8-day at 1 km resolution. - VIIRS Land Surface Temperature from Earthdata Search
- VIIRS Land Surface Temperature/3-Band Emissivity
Choose daily or 8-day at 1 km resolution. - ASTER Surface Kinetic Temperature from Earthdata Search
ASTER Surface Temperature products are processed on-demand and so must be requested with additional parameters. Note that there is a limit to 2000 granules per order. - ECOSTRESS Land Surface Temperature from Earthdata Search
To quickly extract a subset of ECOSTRESS, MODIS, or VIIRS data for your region of interest, use LP DAAC's AppEEARS tool or ORNL DAAC's subsetting tools.
Landsat data can be discovered using Earthdata Search, however, you will need a USGS Earth Explorer login to download the data.
- Landsat 8 Thermal Infrared Sensor from Earthdata Search
Measures land surface temperature in two thermal bands with a new technology that utilizes quantum physics to detect heat.
Data can be visualized in Worldview:
The NASA Earth Exchange Global Daily Downscaled Projections Coupled Model Intercomparison Project Phase 6 (NEX-GDDP-CMIP6) dataset is comprised of high-resolution, bias-corrected global downscaled climate projections derived from the General Circulation Model (GCM) runs conducted under the Coupled Model Intercomparison Project Phase 6 (CMIP6) and across all four “Tier 1” greenhouse gas emissions scenarios known as Shared Socioeconomic Pathways (SSPs).
This dataset provides a set of global, high resolution, bias-corrected climate change projections that can be used to evaluate climate change impacts on processes that are sensitive to finer-scale climate gradients and the effects of local topography on climate conditions. Uses include: air temperature, precipitation volume, humidity, stellar radiation, and atmospheric wind speed.
NEX-GDDP-CMIP6 data are available through the NASA Center for Climate Simulation (NCCS):
Image

NASA’s Precipitation Measurement Missions (PMM) provide a continuous long-term record (over 20 years) of precipitation data through the Tropical Rainfall Measuring Mission (TRMM) and the Global Precipitation Measurement (GPM) mission. GPM, a follow-on mission for TRMM, provides even more accurate measurements, improved detection of light rain and snow, and extended spatial coverage.
The products from TRMM and GPM are available individually and have also been integrated with data from a global constellation of satellites to yield improved spatial/temporal precipitation estimates providing a temporal resolution of 30 minutes (in the case of GPM). The integrated products are the TRMM Multi-satellitE Precipitation Analysis (TMPA) and the Integrated Multi-satellite Retrievals for GPM (IMERG). IMERG’s multiple runs accommodate different user requirements for latency and accuracy (Early = 4 hours, e.g., for flash flood events; Late = 12 hours, e.g., for crop forecasting; and Final = 3 months, with the incorporation of rain gauge data, for research).
NASA, in collaboration with other agencies, has also developed models of precipitation, incorporating satellite information with ground-based data when available. These models are part of the Land Data Assimilation System (LDAS), of which there is a global collection (GLDAS) and a North American collection (NLDAS). LDAS takes inputs of measurements like precipitation, soil texture, topography, and leaf area index and then uses those inputs to model output estimates.
Science quality data products can be accessed via Earthdata Search:
- TMPA from Earthdata Search
Rainfall estimate at 3 hours, 1 day, or near real-time (NRT) and accumulated rainfall at 3 hours and 1 day. Data are in HDF format and can be opened using Panoply. Data are available from 1997. - IMERG from Earthdata Search
Early, Late, and Final precipitation data on the half hour or 1-day timeframe. Data are in NetCDF or HDF format and can be opened using Panoply. Data are available from 2000.
Data products can be visualized as a time-averaged map, an animation, seasonal maps, scatter plots, or a time series through an online interactive tool, Giovanni. Follow these steps to plot data in Giovanni: 1) Select a map plot type; 2) Select a date range. Data are in multiple temporal resolutions and multiple temporal coverages, so be sure to note the start and end date to ensure you access the desired dataset; 3) Check the box of the variable in the left column that you would like to include and then plot the data. For more information on choosing a type of plot, see the Giovanni User Manual.
- TMPA in Giovanni
- IMERG in Giovanni: Data are available from 2000-present.
Near real-time data can be accessed from Worldview.
- IMERG Precipitation Rate in Worldview
- AMSR2 Precipitation Rate in Worldview
Advanced Microwave Scanning Radiometer 2 (AMSR2) instrument collects data that indicate the rate at which precipitation is falling on the surface of the ocean and is measured in millimeters per hour (mm/hr). - NLDAS Precipitation Total in Worldview
- GLDAS Precipitation Total in Worldview (only goes through 2010)
The NLDAS monthly Precipitation Total data are generated through temporal accumulation of the hourly data, and the GLDAS monthly data are generated through temporal averaging of the 3-hourly data. The data are in unit “kg/m2/s” which is equivalent to “mm/s.” - IMERG Early Run Half-Hourly at PMM
The NRT "early run" product at PMM is generated every half hour with a 6-hour latency from the time of data acquisition.
Daymet is a collection of gridded estimates of daily weather parameters. It is modeled on daily meteorological observations. Weather parameters in Daymet include daily minimum and maximum temperature, precipitation, vapor pressure, radiation, snow water equivalent, and day length at 1 km resolution over North America, Puerto Rico, and Hawaii.
Daymet data can be retrieved in a variety of ways, including: Earthdata Search; an ORNL DAAC API; ORNL DAAC tools; and through LP DAAC AppEEARS.
The NASA Earth Exchange Global Daily Downscaled Projections Coupled Model Intercomparison Project Phase 6 (NEX-GDDP-CMIP6) dataset is comprised of high-resolution, bias-corrected global downscaled climate projections derived from the General Circulation Model (GCM) runs conducted under the Coupled Model Intercomparison Project Phase 6 (CMIP6) and across all four “Tier 1” greenhouse gas emissions scenarios known as Shared Socioeconomic Pathways (SSPs).
This dataset provides a set of global, high resolution, bias-corrected climate change projections that can be used to evaluate climate change impacts on processes that are sensitive to finer-scale climate gradients and the effects of local topography on climate conditions. Uses include: air temperature, precipitation volume, humidity, stellar radiation, and atmospheric wind speed.
NEX-GDDP-CMIP6 data are available through the NASA Center for Climate Simulation (NCCS):
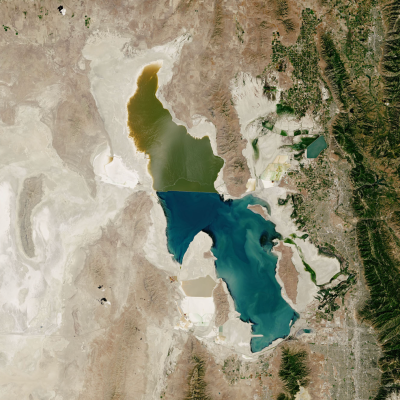
Soil moisture is important for understanding ecosystem productivity, as it controls the amount of water that can infiltrate the ground, replenish aquifers, and contribute to excess runoff. Current ground measurements of soil moisture are sparse and have limited coverage; satellite data help fill in those gaps. On the other hand, satellite data are limited by their relatively coarse resolution; the preferred measurement should be chosen based upon your needs. Utilizing a combination of both ground-based and remote sensing data provides for spatial and temporal data continuity.
NASA's Soil Moisture Active Passive (SMAP) satellite measures the moisture in the top five cm of soil globally, every 2–3 days, at a resolution of 9–36 km. NASA, in collaboration with other agencies, has also developed models of soil moisture content, incorporating satellite information with ground-based data when available. These models are part of LDAS, of which there is a global collection (GLDAS) and a North American collection (NLDAS). LDAS takes inputs of measurements like precipitation, soil texture, topography, and leaf area index and then uses those inputs to model output estimates of soil moisture and evapotranspiration.
Science quality data products can be accessed via Earthdata Search; datasets are available in HDF5 format, which are also customizable to GeoTIFF.
Image
 is the daily average of measurements at 0-100 cm depth.")
ORNL DAAC's Soil Moisture Visualizer integrates ground-based, SMAP, and other soil moisture data into a visualization and data distribution tool. LP DAAC's AppEEARS offers another option to simply and efficiently extract subsets, transform, and visualize SMAP data products. See the Tools for Data Access and Visualization section for additional information.
Data products can be visualized as a time-averaged map, an animation, seasonal maps, scatter plots, or a time series through an online interactive tool, Giovanni. Follow these steps to plot data in Giovanni: 1) Select a map plot type. 2) Select a date range. Data are in multiple temporal resolutions and multiple temporal coverages, so be sure to note the start and end date to ensure you access the desired dataset. 3) Check the box of the variable in the left column that you would like to include and then plot the data. For more information on choosing a type of plot, see the Giovanni User Manual.
Data can be visualized in Worldview:
Image

Snow cover is the presence of snow on land or bodies of water; measurements are acquired during the daytime and under cloud-clear conditions. The Terra and Aqua MODIS instruments measure snow cover.
Research quality data products can be accessed via Earthdata Search; datasets are available in HDF format, which can be opened using Panoply.
- Terra MODIS Snow Cover from Earthdata Search
- Aqua MODIS Snow Cover from Earthdata Search
Data are available daily, 8-day, or monthly at various resolutions. Datasets are also customizable to GeoTIFF.
Data can be visualized in Worldview:
LP DAAC's AppEEARS offers another option to simply and efficiently extract subsets, transform, visualize, and download MODIS Snow Cover data products.
Topography can play an important role in species distribution as biodiversity changes with elevation. According to Biodiversity Atlas of Los Angeles, “common patterns of biodiversity can be observed with changes in elevation, including: a) decreasing species richness (i.e. the number of species) as elevation increases and b) a peak in richness at intermediate elevations, with lower richness at the base and top of the mountain. An increase in species richness with elevation is very rare.”
Image

A method for delineating topography is the Shuttle Radar Topography Mission (SRTM). SRTM provides a digital elevation model of all land between 60 degrees north and 56 degrees south, about 80% of Earth’s landmass. The spatial resolution is 30 m in the horizontal plane. The ASTER Global Digital Elevation Model (GDEM) coverage spans from 83 degrees north latitude to 83 degrees south, encompassing 99% of Earth's landmass. The spatial resolution is 30 m in the horizontal plane.
On average, compared to geodetic points over the U.S., SRTM data has a lower root mean square error (RMSE); RMSE is a commonly used method to express vertical accuracy of elevation datasets. Digital elevation model data accuracy is typically very sensitive to vegetation cover, however. ASTER tends to perform better over certain landcover types.
February 2020, LP DAAC released a new data product, NASADEM, available at 1 arc-second resolution. NASADEM extends the legacy of the SRTM by improving the DEM height accuracy and data coverage as well as providing additional SRTM radar-related data products. The improvements were achieved by reprocessing the original SRTM radar signal data and telemetry data with updated algorithms and auxiliary data not available at the time of the original SRTM processing.
- AppEEARS offers a simple and efficient way to access SRTM and ASTER data.
- SRTM from Earthdata Search
These data were acquired in 2000 and are in raw format (with the ".hgt" extension), which can be opened in most Geographic Information Systems (GIS), such as ArcGIS or QGIS. Data are also customizable to GeoTIFF. - ASTER GDEM from Earthdata Search
Version 3, released August 2019, has a decrease in elevation void area due to the increase of ASTER stereo image data and an improved process as well as a decrease in water area anomaly data (due to using new global water body data). For more information on the new release, read this LP DAAC news release. - NASADEM from Earthdata Search
- SRTM and ASTER DEMs in Worldview
Image

Satellite imagery can be used in the monitoring of marine ecosystems, from algal bloom development to animal migrations to coastal habitat destruction. There are specific Data Pathfinders pertinent to some of these topics. The Water Quality Data Pathfinder provides information on chlorophyll concentration or ocean color data. The Cyclones Data Pathfinder provides information on the parameters in cyclone formation, as well as available observations assessing impacts post-storm.
Certain parameters, like sea surface temperature and salinity, are useful for determining habitat suitability for marine life as well as mapping ocean current flow patterns. These data can also be incorporated into general circulation models and biogeochemistry models important for forecasting animal movement, harmful algal blooms, and changes in climate.
Research quality data products, can be accessed via Earthdata Search:
- Terra MODIS SST data from Earthdata Search
- Aqua MODIS SST data from Earthdata Search
- VIIRS SST level 2 data from Earthdata Search
Data products can be visualized as a time-averaged map, an animation, seasonal maps, scatter plots, or a time series through an online interactive tool, Giovanni. Follow these steps to plot data in Giovanni: 1) Select a map plot type. 2) Select a date range. Data are in multiple temporal resolutions, so be sure to note the start and end date to ensure you access the desired dataset. 3) Check the box of the variable in the left column that you would like to include and then plot the data. For more information on choosing a type of plot, see the Giovanni User Manual.
- Aqua MODIS SST data in Giovanni
Data products from MODIS on the Aqua satellite at 4 km resolution provided at both 8-day and monthly temporal resolutions.
Data can be visualized in Worldview:
The SMAP satellite delivers derived sea surface salinity (SSS) observations for the world’s oceans, in addition to soil moisture. Algorithm development from the Aquarius mission is applied to SMAP to retrieve SSS. The primary SMAP salinity datasets include a Level 2 orbital dataset, in which data granules contain both the ascending and descending arcs of the orbit, and two Level 3 gridded datasets: an 8-day running average (linked to the day repeat cycle of SMAP) and monthly average.
Research quality (higher-level “standard”) data products, can be accessed via Earthdata Search:
Data can be visualized in Worldview: