Ocean surface temperature (SST) can range from 28F near the North and South poles to more than 86F in the tropics. SST measurements provide details on ocean processes and dynamics, and can indicate the location of ocean features including fronts and eddies as well as highlight coastal upwelling and exchanges between the coastal shelf and open ocean. 

SST can directly affect weather systems. For example, warm ocean waters can spawn and intensify tropical storms, hurricanes, and typhoons. Similarly, SST influences climate patterns, such as through the development of warmer water El Niño and cool-water La Niña seasonal weather events that strongly correlate with temperatures and precipitation amounts during North American winters.

SST also is a factor in how healthy ocean environments are for animal and plant life. If temperatures are too warm, they can spawn toxic algal blooms or lead to fish kills and coral bleaching events.

How is Ocean Temperature Measured?

SST can be measured by satellite instrument observations, buoys, ocean gliders, drifters, mooring, ships or from the shoreline. Depending on the method, temperature measurements range in depth from 10 microns up to approximately 15 feet.

NASA’s data archives house current and historical measurements from virtually all of these methods, many in analysis-ready formats and available in the cloud.

Get Sea Surface Temperature Data

Access a range of datasets and data tools to further your sea surface temperature research.

Learn How to Use Sea Surface Temperature Data

This image from PO.DAAC's State of the Ocean tool shows the continent of Australian with red, orange, yellow, green and blue colors around it. These colors are associated with sea surface temperatures, with oranges and reds indicating warm water and greens and blues indicating cooler water.
Data Tool in Focus: State of the Ocean
With the State of the Ocean tool, visualizing ocean data is just a web browser away.
Photograph of Saildrone and researcher
New Saildrone Dataset at NASA’s PO.DAAC
Data from the Atlantic Tradewind Ocean-Atmosphere Mesoscale Interaction Campaign (ATOMIC) shed new light on ocean-atmosphere interactions.
image of cloud over circuit board
From Ocean to Cloud: Enabling Workflows and Data Utilization
This webinar describes how to set up and use cloud services to run analyses on physical oceanography data at NASA's Physical Oceanography Distributed Active Archive Center (PO.DAAC).
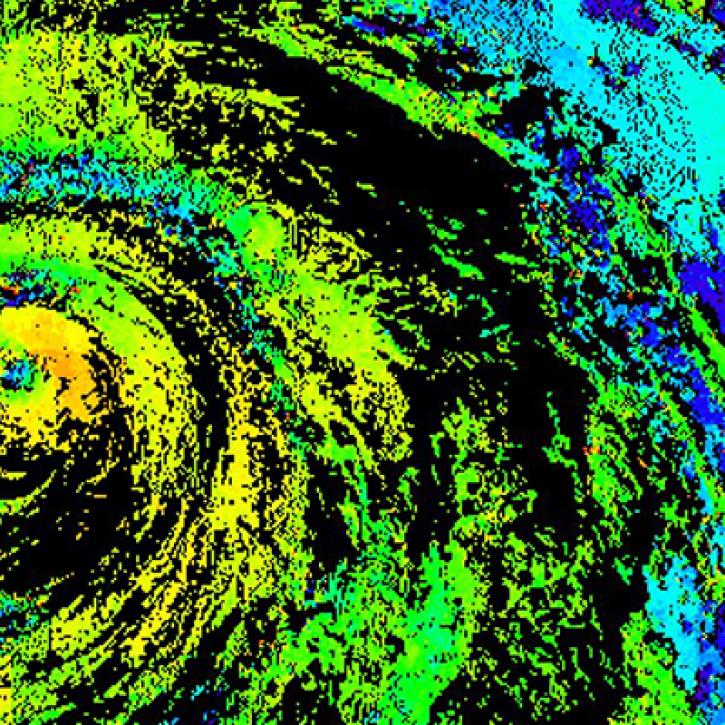
Radar image of the swirl of a tropical storm
Observing Tropical Storms Using NASA GIS Data
Near real-time monitoring of tropical storms and observations of previous hurricanes.
Discover and Visualize Sea Surface Temperature Data
NASA data help us understand Earth's changing systems in more detail than ever before, and visualizations bring these data to life, making Earth science concepts accessible, beautiful, and impactful.
Data visualization is a powerful tool for analysis, trend and pattern recognition, and communication. Our resources help you find world-class data visualizations to complement and enhance your research. We also have tools and tutorials to help you translate sea surface temperature data into compelling visuals.
Image
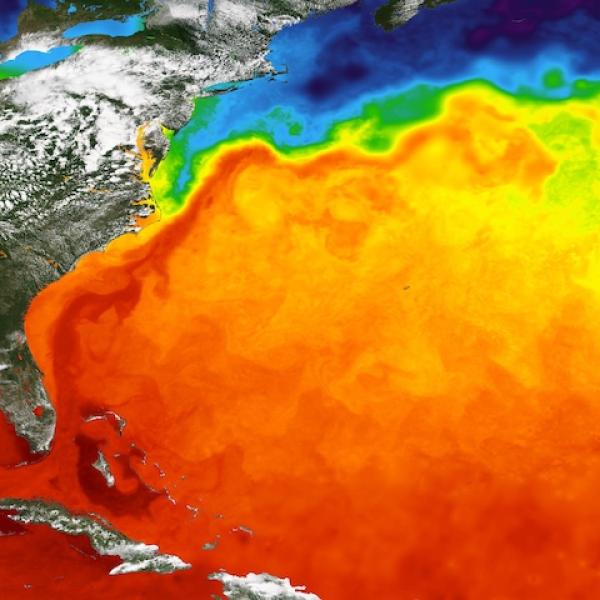
GHRSST Sea Surface Temperature showing the Gulf Stream of the Atlantic Ocean on 29 May 2024
This image shows the Gulf Stream as a ribbon of dark red hugging the East coast of the United States before heading toward the North Atlantic Current and Europe. The base true-color corrected reflectance image was acquired by the Visible Infrared Imaging Radiometer Suite (VIIRS) aboard the joint NASA/NOAA NOAA-20 satellite. Overlaid on the base image is Sea Surface Temperature from the Group for High Resolution Sea Surface Temperature (GHRSST). The Multiscale Ultrahigh Resolution (MUR) L4 analysis is based upon nighttime GHRSST L2P skin and subskin SST observations from several instruments, including the NASA Advanced Microwave Scanning Radiometer-EOS (AMSR-E), the Moderate Resolution Imaging Spectroradiometer (MODIS) aboard NASA's Aqua and Terra platforms, the U.S. Navy microwave WindSat radiometer, and in-situ SST observations from the NOAA iQuam project.

Join Our Community of NASA Data Users

While NASA data are openly available without restriction, an Earthdata Login is required to download data and to use some tools with full functionality.

Learn About the Benefits of Earthdata Login

Frequently Asked Questions

Earthdata Forum

Our online forum provides a space for users to browse thousands of FAQs about research needs, data, and data applications. You can also submit new questions for our experts to answer.

Submit Questions to Earthdata Forumand View Expert Responses
Earthdata
Forum