Land surface temperature (LST) describes how warm or cold surfaces on Earth are and its related processes, such as the exchange of energy and water between the land surface and Earth's atmosphere. LST influences the rate and timing of plant growth and is affected by the albedo — the reflectance — of a surface. These data can improve decision making for water use and irrigation strategies, and are also an indicator for crop health and water stress.

NASA has decades of LST data from an array of instruments such as the the Moderate Resolution Imaging Spectroradiometer (MODIS) and the Visible Infrared Imaging Radiometer Suite (VIIRS) along with modeled data from NASA's NASA’s Land Data Assimilation System (LDAS). Additionally, there are many tutorials and tools available for using the data.

Get Land Surface Temperature Data

Access a range of datasets and data tools to further your land surface temperature research.

Learn How to Use Land Surface Temperature Data

Access a range of webinars, tutorials, data recipes, and data stories to enhance your knowledge of Earth Observation data.
Earthdata graphic identifier on top of satellite data image of Earth
Land Ho! Exploring Earth's Land Surface with Suomi NPP NASA VIIRS Land Data
Looking to learn more about Suomi NPP VIIRS global land data products available from NASA? Watch this webinar for an overview of the data products and live demos on how to access and work with the data using a variety of tools from the Land Processes DAAC.
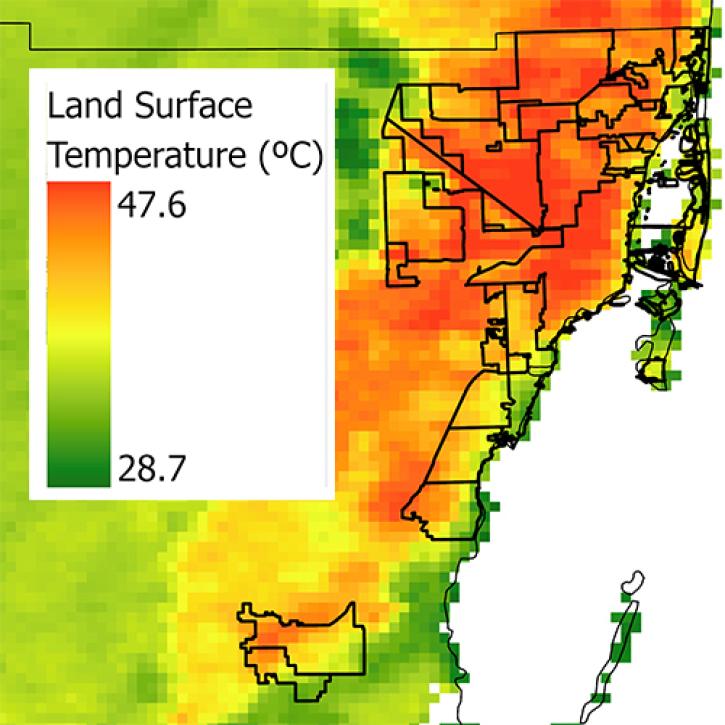
This image shows a temperature map of South Florida and Miami-Dade County using MODIS data. Areas on the right side of the image are in the county and along Florida’s Atlantic coast. These areas are colored in variations of yellow, orange, and red to indicate higher land surface temperatures. The surrounding area is largely colored in shades of green to show lower temperatures. A temperature scale in Celsius is also included showing the range of temperatures from green to red to be from 28.7 to 47.6 deg.
Living in Heat that Kills
A NASA-funded environmental justice study is helping protect Miami-area residents at risk from dangerously high temperatures.
Discover and Visualize Land Surface Temperature Data
NASA data help us understand Earth's changing systems in more detail than ever before, and visualizations bring these data to life, making Earth science concepts accessible, beautiful, and impactful.
Data visualization is a powerful tool for analysis, trend and pattern recognition, and communication. Our resources help you find world-class data visualizations to complement and enhance your research. We also have tools and tutorials to help you translate land surface temperature data into compelling visuals.
Image
daysabovezero_tmo_2015
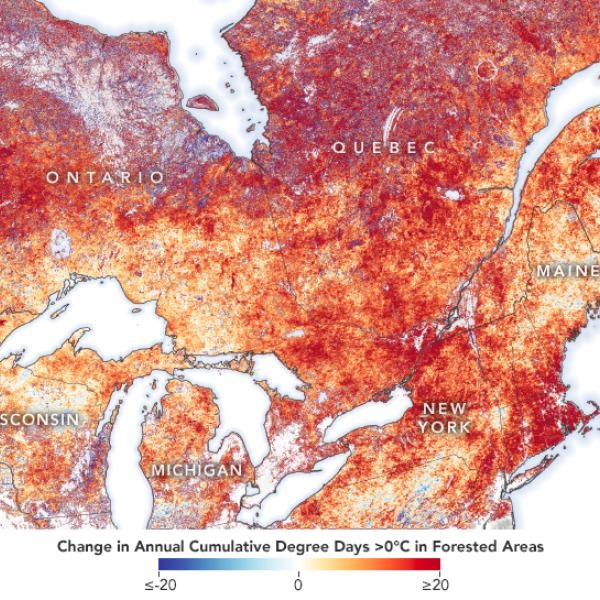
This image visualizes data from the Moderate Resolution Imaging Spectroradiometer (MODIS) using the instrument's land surface temperature and land cover products. It depicts changes in the number of days each year in the northern United States and Southern Canada when temperatures were more than zero degrees centigrade between 2000 and 2015. Regions in blue and white experienced a reduction in days, whereas areas in red and orange saw an increase in days warmer than zero degrees. Credit: Dr. Serge Olivier Kotchi/Public Health Agency of Canada.

Join Our Community of NASA Data Users

While NASA data are openly available without restriction, an Earthdata Login is required to download data and to use some tools with full functionality.

Learn About the Benefits of Earthdata Login

Frequently Asked Questions

Earthdata Forum

Our online forum provides a space for users to browse thousands of FAQs about research needs, data, and data applications. You can also submit new questions for our experts to answer.

Submit Questions to Earthdata Forumand View Expert Responses

Earthdata
Forum