Access a range of datasets and data tools to further your topography research.
Measuring the features and forms of Earth’s solid surfaces allows scientists to learn more about how the planet once was, currently is, and predict how it might one day be. With data collected by NASA’s Earth-observing instruments, researchers can very accurately measure the height and depth of even the remotest places and compare datasets to see how they may have changed. Viewing and comparing these datasets provides scientists with essential information for understanding a broad array of Earth’s physical processes. For example, vulcanologists could track the swelling uplift of a distant, active volcano to see if it may soon erupt.
NASA’s topographic data also help scientists and other professionals in many other ways, such as assessing and designing agricultural and water management practices, responding to flood, fires, landslides and other natural disasters. Additional uses for the data include aiding in ecological conservation and keeping close tabs on the results of climate change on coastline erosion and other land effects.
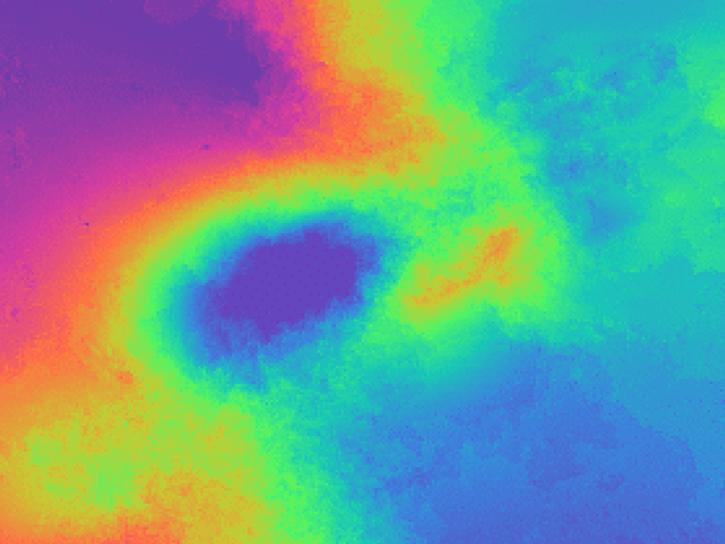
NASA’s topography datasets include Sentinel-1 interferograms, ICESat-2 ice height measurements, surface roughness and atmospheric boundary layer interaction data, and digital elevation models.
Learn How to Use Topography Data


Join Our Community of NASA Data Users
While NASA data are openly available without restriction, an Earthdata Login is required to download data and to use some tools with full functionality.
Learn About the Benefits of Earthdata LoginFrequently Asked Questions
Earthdata Forum
Our online forum provides a space for users to browse thousands of FAQs about research needs, data, and data applications. You can also submit new questions for our experts to answer.
Submit Questions to Earthdata Forumand View Expert Responses