On November 6, 2023, air pollution in Delhi, India, hit an all-time high and then went off the charts. On that day, Delhi's air quality index (AQI) surpassed 500, the scale's maximum level. The pollution sent overwhelming numbers of children to local emergency departments with breathing problems and Delhi officials closed their schools.
The AQI measures ground-level ozone, particles from dust and biofuel combustion and other sources, carbon monoxide, sulfur dioxide, and nitrogen dioxide pollutants. AQI levels of 0-50 are good, 50-200 become increasingly unhealthy for various people, and levels above 200 place everyone at significantly increased risk for illness or worse. AQI levels in Delhi and across India routinely surpasses World Health Organization (WHO) limits for healthy breathing, contributing to the country’s rising rates of cardiopulmonary illness and premature death.
To help clear India's air, NASA and world researchers are using the agency's satellite and ground-based data to understand, monitor, and predict the country's air pollution processes, levels, and effects.
NASA atmospheric scientist Dr. Pawan Gupta is an expert in India's air pollution and specializes in using satellites to monitor air quality.
"India's air pollution sources and seasonality vary across the country,” said Gupta. "The topography and weather patterns in Northern India favor the development of high levels of pollution, especially in areas bordered by the Himalayan mountains and the plains and during the winter season."
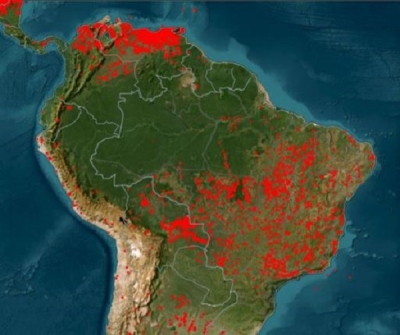
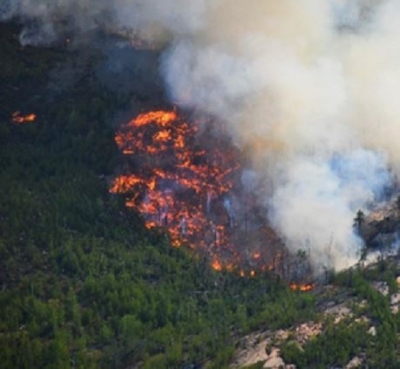
During the cold, dry winter months, cool air in the high mountains forms a low-level boundary layer in the atmosphere. This layer traps particulates near the surface produced by agricultural slash and burn fires and the burning of fuels for cooking and heating, which then raises air pollution levels. In warmer months, winds from the plains and deserts blow dust into the air and make it harder to breathe. In the more densely populated and warmer southern areas, weather and burning biofuels contribute to creating air pollution; however, dust from bare exposed ground along roadways along with smog from industry and transportation play the greatest role in degrading the region’s air quality throughout the year.
Seeing into the Smog
"When we talk about air quality, we generally use two types of data: aerosols and gases," said Gupta. "Over the past 25 years, Indian and other researchers have been using these air quality data to understand the processes, sources, [and] seasonal variability of pollution."
NASA has many datasets from an array of sensors related to air quality that are freely and openly available through Earthdata Search and the agency's webpages. One key source of data is the Moderate Resolution Imaging Spectroradiometer (MODIS) instrument aboard NASA's Aqua and Terra satellites, which provides measurements for aerosol and other data products useful for air quality research. Terra also carries the Multi-Angle Imaging Spectroradiometer (MISR), which records aerosol particle data. The Visible Infrared Imaging Radiometer Suite (VIIRS) aboard the joint NASA/NOAA Suomi National Polar-orbiting Partnership (Suomi NPP), NOAA-20, and NOAA-21 satellites provides similar, next-generation data. Along with satellite-acquired data, NASA offers on-the-ground data through the global AErosol RObotic NETwork (AERONET) of linked ground stations that provide aerosol measurements every 5-15 minutes. Among its more than 600 active ground stations, AERONET includes nine units in India.
It’s Unfair Who Breathes the Dirty Air

As researchers learn more about the nature of air pollution, many are turning to revealing how it hurts people and who is most at risk.
"In the past five years more and more research has focused on the impact of pollution on human health," said Gupta.
This new focus is leading to innovative datasets geared toward socioeconomic and environmental justice studies. One such dataset is the Global (GL) Annual PM2.5 Grids, which provides annual global concentrations of ground-level fine particulate matter 2.5 micrometers or smaller (designated PM2.5) for large-scale health and environmental research. The dataset includes measurements from MODIS, MISR, and the Sea-Viewing Wide Field-of-View Sensor (SeaWiFS). The dataset is available through NASA's Socioeconomic Data and Applications Center (SEDAC).
Dr. Priyanka deSouza from the University of Colorado recently used a version of the dataset in a 2023 study published in Scientific Reports that provided an environmental justice analysis of air pollution in India.
"Air pollution mitigation in India is a big issue because is out of compliance with WHO guidelines, and many cities are out of compliance with the Indian national ambient air quality standards," said deSouza.
For her study, deSouza incorporated the annual PM2.5 grids with data from a nation-wide survey gathering socioeconomic information from Indian residents, including their religion and social caste. She used the data to map where PM2.5 levels are highest and describe who lives there. "We found that there are subpopulations of people who are disproportionately suffering from PM2.5 pollution exposure," said deSouza.
Specifically, the data revealed that areas with higher levels of PM2.5 tended to have higher levels of lower caste members. What's more, vulnerable populations, such as Scheduled Tribes officially identified by the Indian government as socially disadvantaged, tended to use less energy from power plants and other sources, making them disproportionately burdened by pollution relative to their energy use.
There were differences in rural and urban areas as well. Poorer urban areas had higher levels of PM2.5 compared with poorer rural communities. The difference is likely explained by the fact that while people in poorer, rural areas may still use particle-producing biomass for cooking and heating (such as wood or coal), they don't have as much access to cars and other vehicles that further contribute to pollution.
"What this all means is that India's mitigation strategies should incorporate concerns of equity and prioritize areas with these vulnerable populations," said deSouza.
DeSouza's study is a great example of how the global annual PM2.5 grids and NASA's other air quality data can help us see through the pollution problems in India or around the world. If you would like to learn more or use the data, check out these NASA resources:
- NASA Earth Science Data Systems (ESDS) Air Quality Resources
- NASA Near Real-Time Air Quality Data
- Using Satellite Data to Solve Real-World Health and Air Quality Issues
- Earthdata Webinar: An Introduction to NASA's SEDAC Datasets for Health and Air Quality Impacts
- Understanding Needs to Broaden Outside Use of NASA Data (UNBOUND) Air Quality workshop report
- NASA Science Air Quality Information Page