
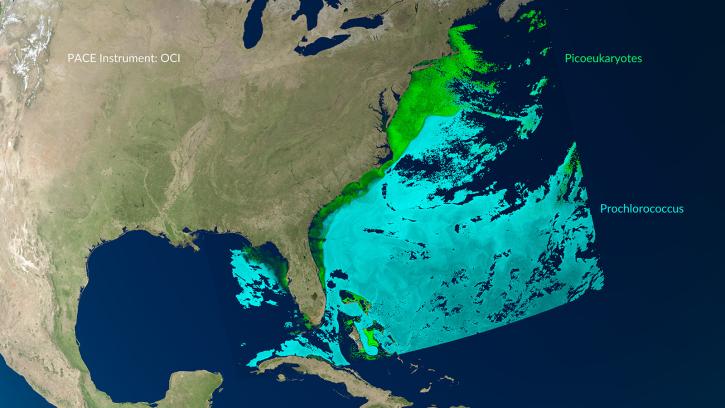
Ocean color is a measure of sunlight that is reflected by the water and its components, such as phytoplankton, sediments, and colored dissolved organic matter (CDOM). Remotely collected ocean color data can be used as a substitute for directly sampling and examining water quality in any body of water. For example, estimates of chlorophyll-a in phytoplankton concentrations calculated from ocean color data are used as an indicator for harmful algal blooms (HABs), which occur when algae containing toxins grow out of control. These blooms can wreak havoc on the organisms that live in or depend on that ecosystem and can contaminate seafood. 

The primary instruments for measuring ocean color include the Moderate Resolution Imaging Spectroradiometers (MODIS) aboard NASA’s Terra and Aqua satellites, the Visible Infrared Imaging Radiometer Suite (VIIRS) on the joint NASA/NOAA Suomi National Polar-orbiting Partnership (Suomi NPP) and NOAA-20 satellites, and the Plankton, Aerosol, Cloud, ocean Ecosystem (PACE) satellite. The joint NASA/USGS Landsat series of satellites and the ESA Sentinel-2 satellites can also be used for observations of coastal waters and lakes.

Get Ocean Color Data

Access a range of datasets and data tools to further your ocean color research.

Learn How to Use Ocean Color Data

Access a range of webinars, tutorials, data recipes, and data stories to enhance your knowledge of Earth Observation data.
This rectangular image shows phytoplankton levels along Florida and the East Coast of the United States, the Bahamas, and Cuba. Land is colored in muted shades of brown and green, water is dark blue, and snow is white. Nearshore are bands of light to dark green depicting picoeukaryote organism levels. Further out to sea are regions in variations of light blue showing the presences of prochlorococcus cyanobacteria.
New PACE Data Tutorials
A series of Jupyter notebook tutorials show how to retrieve and use data from NASA's Plankton, Aerosol, Cloud, ocean Ecosystem (PACE) mission.
Blue rectangle with word SEADAS in white with a small square next to it overlain on a data image showing a land mass and ocean with colored data in the water
Data Tool in Focus: SeaDAS
The SeaDAS software application lets users process, visualize, and analyze NASA ocean color and other data products.
Discover and Visualize Ocean Color Data
NASA data help us understand Earth's changing systems in more detail than ever before, and visualizations bring these data to life, making Earth science concepts accessible, beautiful, and impactful.
Data visualization is a powerful tool for analysis, trend and pattern recognition, and communication. Our resources help you find world-class data visualizations to complement and enhance your research. We also have tools and tutorials to help you translate ocean color data into compelling visuals.
Image
True color corrected reflectance image overlaid with chlorophyll a concentrations of southwestern South Africa from the OCI instrument aboard the PACE platform
This image acquired by the Ocean Color Instrument (OCI) aboard the Plankton, Aerosol, Cloud, ocean Ecosystem (PACE) platform shows high chlorophyll-a concentrations off the southwestern coast of South Africa on October 22, 2024 (indicated in colors of red and dark red).

Join Our Community of NASA Data Users

While NASA data are openly available without restriction, an Earthdata Login is required to download data and to use some tools with full functionality.

Learn About the Benefits of Earthdata Login

Frequently Asked Questions

Earthdata Forum

Our online forum provides a space for users to browse thousands of FAQs about research needs, data, and data applications. You can also submit new questions for our experts to answer.

Submit Questions to Earthdata Forumand View Expert Responses

Earthdata
Forum