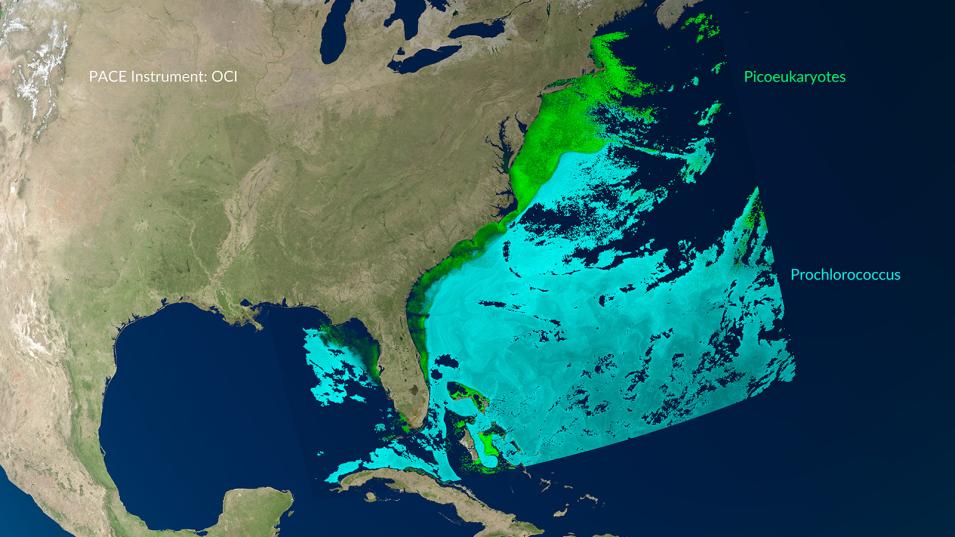
NASA's Plankton, Aerosol, Cloud, ocean Ecosystem (PACE) spacecraft recently began providing scientists with their first look at the high-resolution, hyperspectral data that so many have been anxiously waiting to see. Now that the data are flowing, the PACE team is developing a series of Jupyter notebook tutorials to guide researchers using the Python coding language to access, visualize, and analyze PACE data. These data are available through NASA’s Ocean Biology Distributed Active Archive Center (OB.DAAC).
New PACE Data Tutorials
A Jupyter notebook is an open source, interactive platform for designing scientific research and project presentations featuring text, multimedia, equations, active scripts, and other content. Through Jupyter notebooks, the PACE team can literally show and tell how to work with PACE data in Python.
"We will have Jupyter notebook tutorials focusing on all three PACE instruments: the Ocean Color Instrument (OCI), the Hyper-Angular Rainbow Polarimeter #2 (HARP2), and the Spectro-polarimeter for Planetary Exploration one (SPEXone)," said Dr. Anna Windle, a postdoctoral researcher with the PACE mission and co-developer of the tutorials.
Windle created the first tutorials along with Dr. Ian Carroll, Dr. Carina Poulin, and Dr. Guoqing Wang from the PACE team.
The tutorials are geared towards any scientist interested in accessing and analyzing PACE data and offer options for being run locally on personal computers or in the cloud. Beginner level Python skills are required to use the tutorials and to run the notebooks locally. Some knowledge of netCDF format is helpful; however, the organization of data in netCDF format is covered in one of the first tutorials.
The first Jupyter notebook tutorials published are:
- Access Data from the Ocean Color Instrument: Learn how to use the earthaccess Python library to search and download OCI products hosted on NASA Earthdata
- File Structure at Three Processing Levels for the Ocean Color Instrument: Learn how to use XArray to open and analyze OCI data
"We chose the first topic of data access to show users how to use the earthaccess Python library to search for, download, or stream NASA PACE Earthdata with just a few lines of code," said Windle. "These lines of code are necessary for all the other tutorials to access the data."
The second tutorial briefly explains differences between Level 1B, Level 2, and Level 3 OCI files, and provides examples of how to open and analyze the different parameters in each of the different file levels. These topics are important to understand before moving forward with more advanced processing, which makes these first two notebooks prerequisites for all future OCI tutorials.
Future tutorials will cover accessing and downloading HARP2 and SPEXone data using the earthaccess Python library. There will also be notebooks focusing on analyzing the data using various Python libraries for subsetting, plotting, and mapping data, finding in-situ matchups, creating data animations, and more.
All of the tutorials are planned to be available by early August and will be part of PACE Hackweek taking place August 4-8, 2024. All PACE Hackweek lecture and tutorial presentations will be recorded and shared publicly online.
Explore PACE Tutorials and Learn More About PACE Data
- Visit the OB.DAAC's Ocean Color Tutorials and Data Recipes webpage to access PACE data tutorials
- Webinar: Keeping PACE: Introduction to PACE Mission, Products, and Data Discovery
