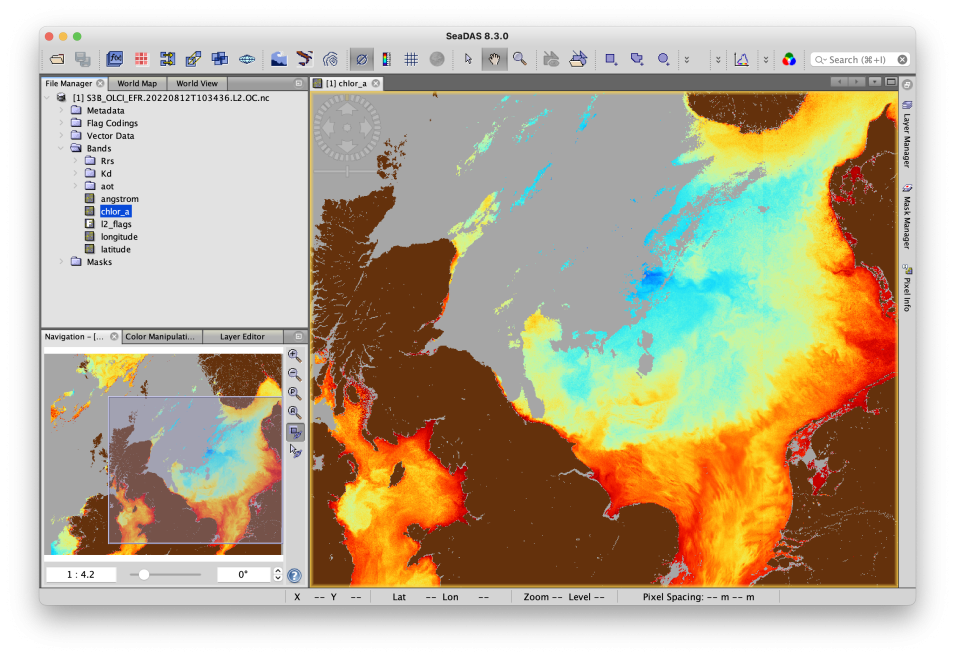
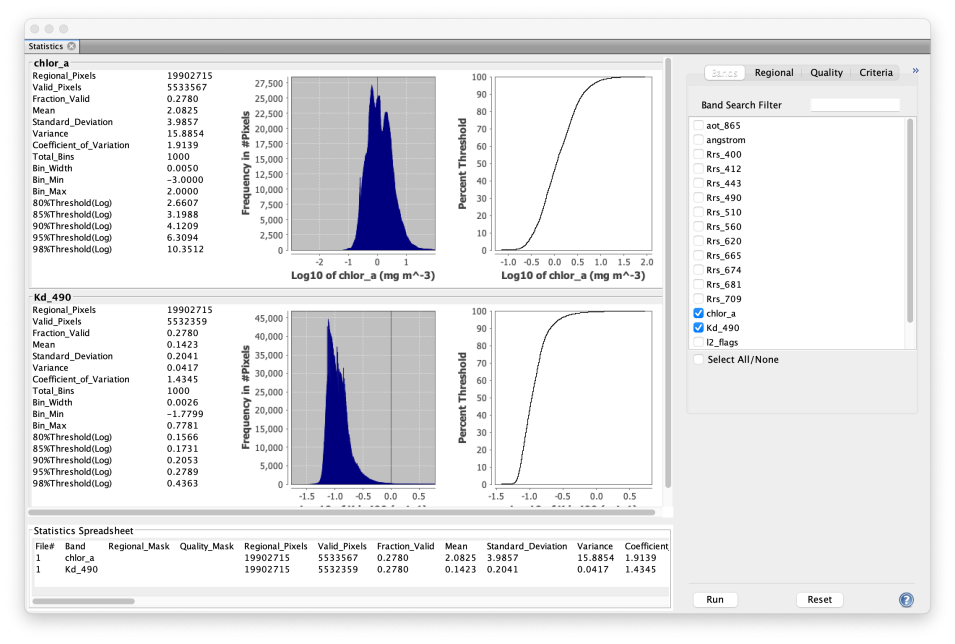
Finally, SeaDAS enables users to process and work with raw data from all of the more than 20 supported missions in a way that meets their individual needs.
“OB.DAAC provides specific data products, processed with specific parameters, but there are hundreds, even thousands of data products that can be generated with SeaDAS," said Daniel S. Knowles, an OB.DAAC software developer. "For example, OB.DAAC has a specific algorithm for chlorophyll-a that is a blend of two algorithms, but there are more than 20 variants of the chlorophyl-a product determined by different algorithms. So, instead of bogging the user down with 20-plus versions of [the] chlorophyll-a product, the DAAC provides a single standard accepted version. But a SeaDAS user could process the raw satellite data with other algorithms to create files containing any or all of these chlorophyll-a variants.”
Knowles also pointed out that users may want to use alternate processing options to manipulate other satellite scene parameters, such as atmospheric correction, quality flags, or resolution. “OB.DAAC provides specific resolutions of satellite images, but there are many resolutions that can be generated depending on the satellite,” he said. “Also, the atmospheric correction algorithm differs over ocean as opposed to over land, so users wanting data for a big lake or coastal region may wish to process those data using a different atmospheric correction algorithm to avoid land corrections that they may not want to retain.”
Knowles also noted that, for mapped data, specific flag settings have been used to mask out data that do not meet quality requirements. However, since the default quality levels are stringent, SeaDAS lets users obtain more data by relaxing certain flag quality restrictions, such as those pertaining to Sun glint.
This flexibility is a boon to SeaDAS users, whether they are novices or experts.
“Users can run SeaDAS with its pre-defined defaults and process raw satellite data to replicate an OB.DAAC Level-2 or Level-3 file. This alone validates the OB.DAAC processed file, in that a user could evaluate the code, the algorithms, etc., and prove that the OB.DAAC file is traceable and came from the source raw satellite data,” Knowles said. “But most significantly, users can fine-tune any of the SeaDAS processing options such that they can generate Level-2 and Level-3 files specific to their unique scientific analysis needs, requirements, and quality acceptance thresholds.”
SeaDAS won NASA Inventions and Contributions Board (ICB) Software of the Year Award in 2003 for providing users with easy access to high quality ocean color data while simultaneously offering flexible, customized processing. Since then, it has only gotten better.
“I started using the [Interactive Data Language] version of SeaDAS back when it was a small graphical user interface with five processing buttons,” said Dr. Brian Barnes, research assistant professor at the University of South Florida and a self-described SeaDAS “power user.” “Now, it’s much more focused on the data visualization. You still have all of the processing capabilities, but about 10 years ago, when SeaDAS Version 7 came out, it changed to a Java-based environment with more of a visual element.”
In the coming months, SeaDAS’ utility will grow even more as OB.DAAC works to incorporate data from new Earth-observing missions.
“For the past 10 years, we’ve been treating SeaDAS as a brand and when making data products, our focus has been on ocean color,” said Knowles. “However, the original SeaDAS acronym—the SeaWiFS Data Analysis System—is associated with the SeaWiFS instrument and when SeaWiFS was dreamed up, that vision went beyond ocean color. Now, with the Plankton, Aerosol, Cloud, ocean Ecosystem (PACE) mission coming along, we’re going back to that original vision and redefining the SeaDAS acronym as ‘Sea, Earth, and Atmosphere Data Analysis System,’ because we are making products beyond ocean color.”
Scheduled to launch in 2024, the PACE mission is designed to both extend and improve NASA's more than 20-year record of satellite observations of global ocean biology, aerosols, and clouds. Outfitted with an updated spectrometer, the Ocean Color Instrument (OCI), and two Multiangle Polarimeters (the HARP2 and SPEXone), PACE will provide a suite of data products pertaining to the atmosphere and land as well as the ocean. SeaDAS will fully support PACE data and PACE processing, and will add tools helpful in analyzing the data from PACE’s polarimeters.
NASA's OB.DAAC is managed by the OBPG and is responsible for archiving satellite ocean biology data produced or collected under NASA’s Earth Observing System Data and Information System (EOSDIS). OB.DAAC's holdings include a mixture of historical and current missions, as well as data from NASA and its partner organizations in the U.S. and abroad.
Get SeaDAS
SeaDAS is available for download via the OB.DAAC website (user authentication is required, which is different from Earthdata Login), and information on how to install and run SeaDAS is available on the SeaDAS GitHub website. To see a complete list of suggested hardware and configuration requirements for supported systems, see the SeaDAS website.
Resources
- The SeaDAS website offers an in-depth help section; users can also post questions about SeaDAS to the OB.DAAC user community on NASA’s Earthdata Forum
- The SeaDAS website also features several video tutorials
- The following webinars are available on the Earthdata website:

