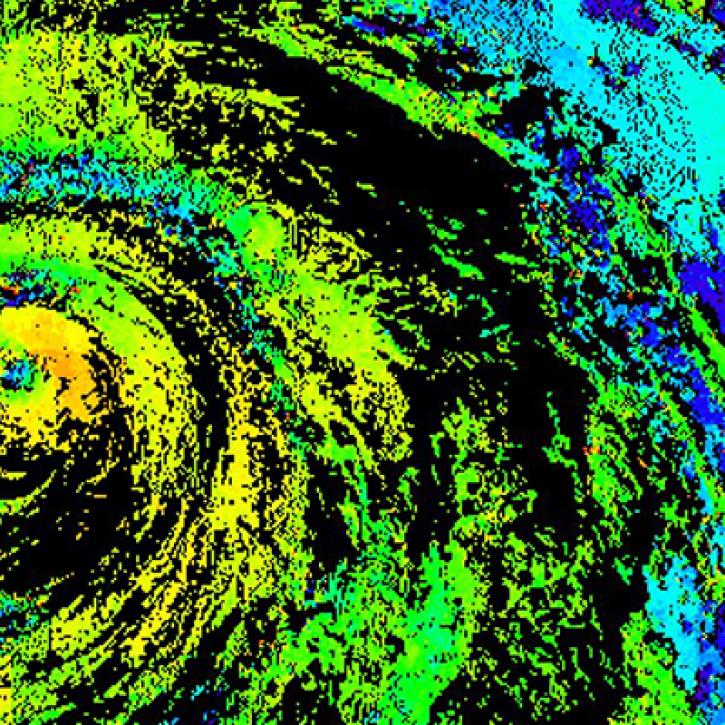
Tropical cyclones are one of the biggest threats to life and property. As defined by the World Meteorological Organization (WMO), a tropical cyclone is a rotating storm originating over a tropical ocean basin that has a low pressure center (the eye). The diameter of a tropical cyclone is typically 124 to 311 miles (200 to 500 km), but can be as large as 621 miles (1,000 km). These massive storms bring sustained high wind and heavy rainfall, and can devastate coastal communities with storm surges and both coastal and inland areas with flooding and wind damage. 

Earth observation data are vital in planning for and dealing with the many hazards from tropical cyclones, such as storm surge, flooding, extreme winds, tornadoes, and lightning. Over the past 50 years, tropical cyclones have killed more than 779,000 people and caused more than $1.4 trillion in economic losses worldwide, according to the WMO. 

NASA Earth-observing satellites provide data that can help in pre-storm emergency preparedness and post-storm damage assessment and response, such as precipitation rate, relative humidity, cloud and sea surface temperatures, and flooding maps. In addition to the datasets here, NASA projects and initiatives also may have cyclone-related data or tools. 

Get Tropical Cyclones Data

Access a range of datasets and data tools to further your tropical cyclones research.

Learn How to Use Tropical Cyclones Data
Access a range of webinars, tutorials, data recipes, and data stories to enhance your knowledge of Earth Observation data.
Earthdata graphic identifier on top of satellite image of Earth
HS3 CPL Attenuated Total Backscatter Quick View
This data recipe instructs users on how to generate vertical time-height plots of Hurricane and Severe Storm Sentinel (HS3) Global Hawk Cloud Physics Lidar (CPL) attenuated total backscatter measurements using a Python plotting routine.
Radar image of the swirl of a tropical storm
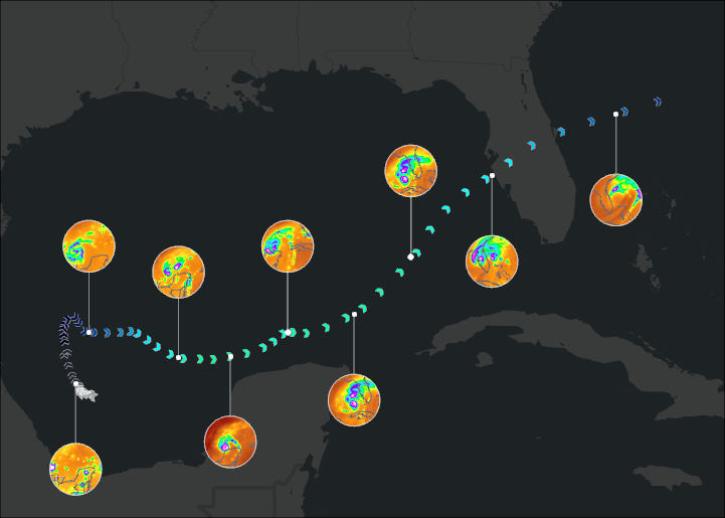
Observing Tropical Storms using NASA GIS Data
Explore near real-time monitoring of tropical storms and observations of previous hurricanes.
Discover and Visualize Tropical Cyclones Data
NASA data help us understand Earth's changing systems in more detail than ever before, and visualizations bring these data to life, making Earth science concepts accessible, beautiful, and impactful.
Data visualization is a powerful tool for analysis, trend and pattern recognition, and communication. Our resources help you find world-class data visualizations to complement and enhance your research. We also have tools and tutorials to help you translate tropical cyclones data into compelling visuals.
Image
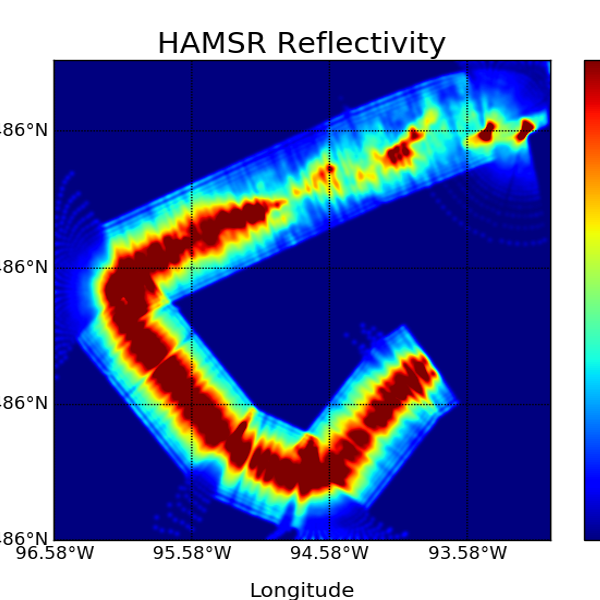
The figure depicts a sample plot generated by the HS3 HAMSR Radar Reflectivity Profile Data Subset Quick View
Imagery from the Hurricane and Severe Storm Sentinel (HS3) campaign's Global Hawk High Altitude MMIC Sounding Radiometer (HAMSR) dataset was used to examine the relative roles of large-scale environment and storm-scale internal processes as well as address the roles of the Saharan Air Layer (SAL) in tropical storm formation and intensification and deep convection in the inner-core region of storms. This dataset also contains measurements that can be used to infer the three-dimensional distribution of temperature, water vapor, and cloud liquid water profiles in the atmosphere—even in the presence of clouds.

Join Our Community of NASA Data Users

While NASA data are openly available without restriction, an Earthdata Login is required to download data and to use some tools with full functionality.

Learn About the Benefits of Earthdata Login

Frequently Asked Questions

Earthdata Forum

Our online forum provides a space for users to browse thousands of FAQs about research needs, data, and data applications. You can also submit new questions for our experts to answer.

Submit Questions to Earthdata Forumand View Expert Responses
Earthdata
Forum