Content from all Earth science data sites are migrating into this site from now until end of 2026. Not all NASA Earth science data will appear across the site until then. Thank you for your patience as we make this transition.
Read about the Web Unification Project
Tropical Cyclones Data Access and Tools
From discovery to visualization, data tools such as Worldview, Application for Extracting and Exploring Analysis Ready Samples (AppEEARS), and the Moderate Resolution Imaging Spectroradiometer (MODIS)/Visible Infrared Imaging Radiometer Suite (VIIRS) Subsetting Tools Suite guide users in making the most of tropical cyclones data.
Tropical Cyclones Data Tools
| Tool Sort descending | Description | Services | |
|---|---|---|---|
| AppEEARS | The The Application for Extracting and Exploring Analysis Ready Samples (AppEEARS) offers users a simple and efficient way to perform data access and transformation processes. | Search and Discovery, Subsetting, Customization, Downloading, Visualization | |
| Hazards Mapper | The Hazards Mapper enables users to rapidly get an idea of the population, land area, dams, and nuclear power plants that could be impacted by a wide range of natural events, including floods, earthquakes, fires, and volcanic eruptions. | Analysis, Search and Discovery, Visualization | |
| Hurricane Intensity Estimator | NASA's Hurricane Intensity Estimator is an online platform that demonstrates the use of a machine learning model for estimating the wind speed of hurricanes. | Visualization, Monitoring Natural Events | |
| Panoply | Panoply is a cross-platform application that plots geo-referenced and other arrays from netCDF, HDF, GRIB, and other datasets. | Visualization, Customization, Reformatting, Subsetting, Comparison | |
| SDAT | The Spatial Data Access Tool (SDAT) is an Open Geospatial Consortium (OGC) standards-based web application to visualize and download spatial data in various user-selected spatial/temporal extents, file formats, and projections. | Analysis, Search and Discovery, Visualization | |
| SOTO | State of the Ocean (SOTO) is an interactive web-based tool that generates informative maps, animations, and plots that communicate and prove the discovery and analysis of the state of the oceans. | Analysis, Search and Discovery, Visualization | |
| VEDA | NASA's Visualization, Exploration, and Data Analysis (VEDA) project is an open-source science cyberinfrastructure for data processing, visualization, exploration, and geographic information systems (GIS) capabilities. | Access, Analysis, Processing, Visualization, Geoprocessing | |
| Vertex | Vertex is a graphical search interface for finding synthetic aperture radar (SAR) data. | Search and Discovery, Access, Downloading, Processing, Subsetting | |
| Worldview | Worldview offers the capability to interactively browse over 1,200 global, full-resolution satellite imagery layers and download the underlying data. | Analysis, Search and Discovery, Visualization |
SHOWING 9 OF 9
Featured Observation Method: VIIRS
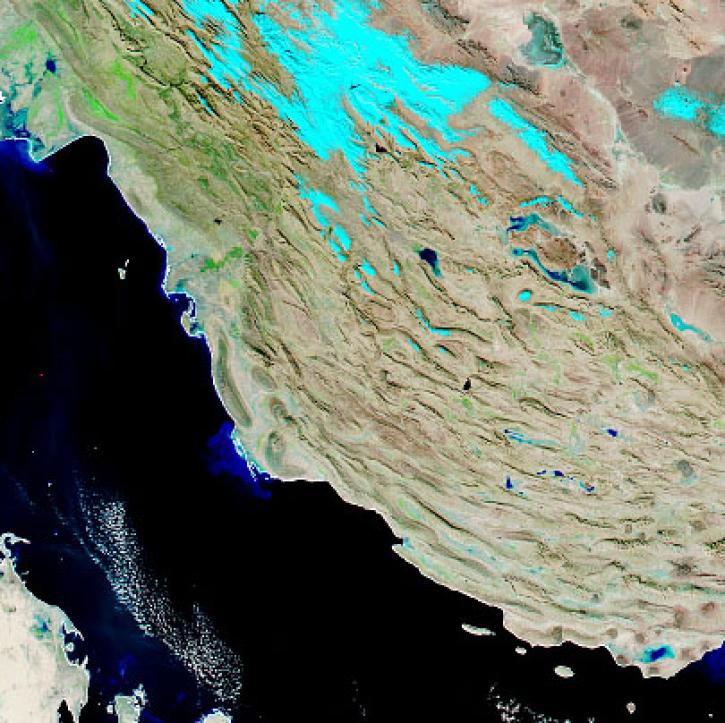
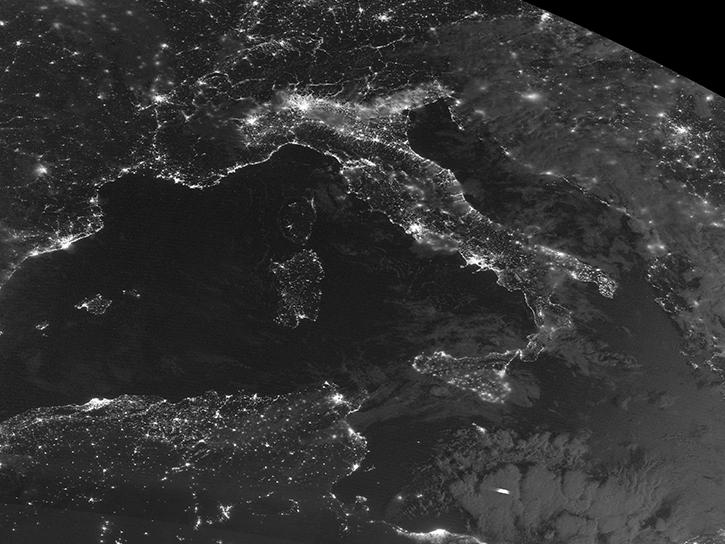
The Visible Infrared Imaging Radiometer Suite (VIIRS) is an instrument aboard the joint NASA/NOAA Suomi National Polar-orbiting Partnership (Suomi NPP) and NOAA-20 platforms. VIIRS can take daily images cross multiple spectrum bands to collect high-resolution atmospheric imagery and other instrument products including visible and infrared images of hurricanes.
With the eventual retirement of the Terra and Aqua platforms, the Visible Infrared Imaging Radiometer Suite (VIIRS) instruments will take the lead in daily Earth observations.
19 MIN READ

VIIRS I-band (375 m) Active Fire and Corrected Reflectance products are the newest near real-time products available through LANCE.
The new Level 1 products are created from data acquired by the Visible Infrared Imaging Radiometer Suite (VIIRS) aboard the NOAA-21/Joint Polar Satellite System-2 (JPSS-2) spacecraft.
Join us to learn how to discover, subset, access and visualize both MODIS and VIIRS data products using a suite of user-friendly tools developed by NASA's ORNL DAAC.
Datasets
| Dataset | Size | Start Date | End Date | N Lat | S Lat | E long | W Long |
|---|---|---|---|---|---|---|---|
| GRIP Hurricane and Tropical Storm Forecasts V1 | 87.60 | 0.80 | -178.50 | ||||
| HURRICANE AND SEVERE STORM SENTINEL (HS3) GLOBAL HAWK NAVIGATION V1 | 51.53 | 7.56 | -19.42 | -174.84 | |||
| HURRICANE AND SEVERE STORM SENTINEL (HS3) WORLD WIDE LIGHTNING LOCATION NETWORK (WWLLN) STORMS V1 | 68.99 | 12.90 | -15.00 | -116.60 |
SHOWING 3 OF 3
Frequently Asked Questions
Earthdata Forum
Our online forum provides a space for users to browse thousands of FAQs about research needs, data, and data applications. You can also submit new questions for our experts to answer.
Submit Questions to Earthdata Forumand View Expert Responses