Natural disasters affect millions of people every year. According to the United Nations Office for Disaster Risk Reduction (UNDRR), there were roughly 7250 disasters between 1998 and 2017, killing over 1.3 million people. Of those, flooding and storms account for the greatest number of disasters, while earthquakes cause the largest number of deaths; close to 750,000 people died from earthquakes during that period. Climate change will likely increase the frequency of extreme heat and other extreme weather events in the coming decades.

Understanding the vulnerability and exposure of a community to a disaster aids in the mitigation, prevention, and management of the disaster, while also providing information to help with response and relief efforts. NASA’s Earth-observing satellites collect global data on a number of phenomena that cause disasters, including flooding, droughts, cyclonic storms, earthquakes, volcanic eruptions, landslides, and extreme heat events. NASA also provides socioeconomic datasets to help assess the exposure and vulnerability of communities to these disasters. 

Our data products useful to the study of natural disasters include hazard frequency and distribution maps, climate risk projections, mortality risk measures, and economic loss risk deciles.

Learn more about how our data informs a better understanding of tropical cyclones, earthquakes, volcanoes, extreme heat, floods, landslides, droughts, and wildfires.

Natural Hazards Near Real-time Data

Much of NASA's natural hazard data updates in real and near real-time, allowing a data-driven approach to disaster response. Learn more about near real-time data related to natural hazards provided by NASA's Land, Atmosphere Near real-time Capability for Earth observations (LANCE).

Get Natural Hazards Data

Access a range of datasets and data tools to further your research into natural hazards.

Learn How to Use Natural Hazards Data
Access a range of webinars, tutorials, data recipes, and data stories to enhance your knowledge of Earth Observation data.
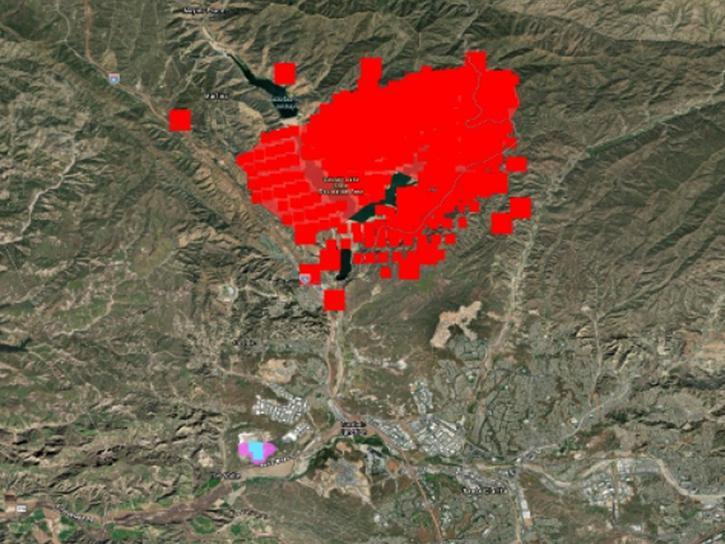
FIRMS imagery shows the Hughes Fire active fire detections occurring during January 22, 2025 (red); Static Thermal Anomalies - Detections from the overnight hours of January 22-23 associated with the landfill to the southwest (cyan); and Static Thermal Anomalies - Mask layer (pink).
FIRMS Releases New Features to Identify Active Fires by Type
Users of NASA’s Fire Information for Resource Management System (FIRMS) can now differentiate between fires caused by burning vegetation and fires from natural heat sources or industrial heat sources.
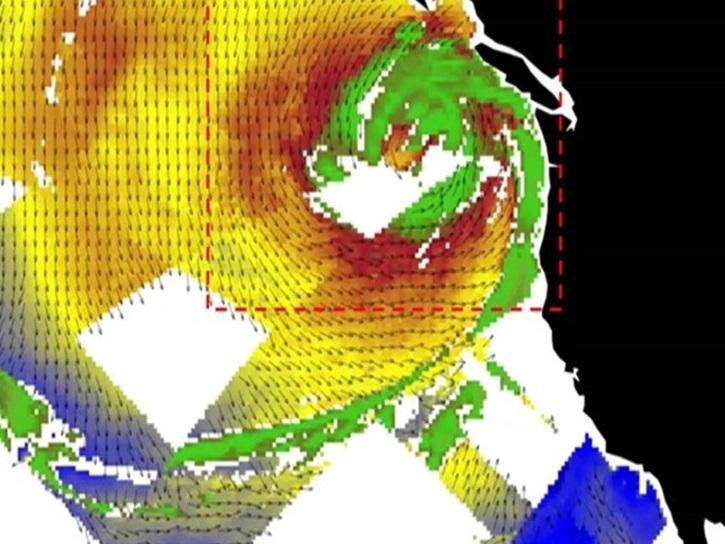
A visualization of COWVR wind speed and direction data during a bomb cyclone in November 2024.
COWVR and TEMPEST V10 Datasets Available in First Public Release
The Compact Ocean Wind Vector Radiometer (COWVR) and Temporal Experiment for Storms and Tropical Systems (TEMPEST) datasets are the first from the Space Test Program - Houston 8 (STP-H8) mission that aims to test low-cost, light-weight instruments designed for weather applications.
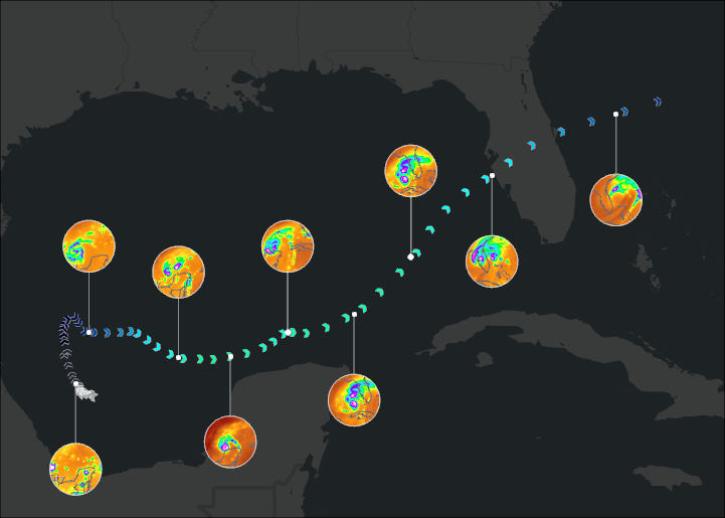
This image shows Hurricane Milton’s storm path between October 5-10, 2024 using Time-Resolved Observations of Precipitation structure and storm Intensity with a Constellation of Smallsats (TROPICS) Level 1B Brightness Temperature and International Best Track Archive for Climate Stewardship database from NOAA’s National Centers for Environmental Information (NCEI) datasets.
Examining Hurricane Milton's Milestones with NASA's GES DISC Datasets
Learn how to access and use MERRA-2, GPM, TROPICS, and LDAS data provided by NASA's Goddard Earth Sciences Data and Information Services Center (GES DISC) to investigate Hurricane Milton's milestones.
GES DISC Webinar thumbnail image showing extreme precipitation in California 2023.
Analyzing Precipitation Extremes Using Cloud Computing
This webinar delves into the use of public Zarr store and cloud computing to investigate extreme precipitation events.
Discover and Visualize Natural Hazards Data
NASA data helps us understand Earth's changing systems in more detail than ever before, and visualizations bring these data to life, making Earth science concepts accessible, beautiful, and impactful.
Data visualization is a powerful tool for analysis, trend and pattern recognition, and communication. Our resources help you find world-class data visualizations to complement and enhance your research. We also have tools and tutorials to help you translate data about wildfires, floods, cyclones, landslides, and other natural disasters into effective visuals.
Image
This nighttime image from the VIIRS instrument shows Tropical Storm Alberto in the Gulf of Mexico on June 20, 2024.
This nighttime visible image created with data from the Visible Infrared Imaging Radiometer Suite (VIIRS) shows Tropical Storm Alberto in the Gulf of Mexico on June 20, 2024. Credit: U.S. Naval Research Laboratory

Join Our Community of NASA Data Users

While NASA data are openly available without restriction, an Earthdata Login is required to download data and to use some tools with full functionality.

Learn About the Benefits of Earthdata Login

Frequently Asked Questions

Earthdata Forum

Our online forum provides a space for users to browse thousands of FAQs about research needs, data, and data applications. You can also submit new questions for our experts to answer.

Submit Questions to Earthdata Forumand View Expert Responses

Earthdata
Forum