FIRMS Releases New Features to Identify Active Fires by Type

Users of NASA’s Fire Information for Resource Management System (FIRMS) can now differentiate between fires caused by burning vegetation and fires from natural heat sources or industrial heat sources.

Satellites can be used to detect all types of fires and other sources of thermal anomalies. This includes thermal activity resulting from burning vegetation (for example, wildland fires or agricultural burning) as well as energy emitted from other, relatively isolated sources of combustion that emit thermal energy. The latter can include other types of natural heat sources (volcanic and other geothermal activity) as well as multiple types of industrial heat sources (including mineral processing plants, gas flares, waste incinerators, cement plants, steel plants, and petrochemical plants). Discerning this type of thermal activity in satellite active fire detection data requires additional information and analysis capabilities. 

Enhancing the FIRMS Fire Map Viewer

NASA’s Fire Information for Resource Management System (FIRMS) team has developed and integrated additional data layers and new capabilities within the FIRMS Fire Map viewer to identify active fire detections not associated with vegetation fires. One of these layers is the Static Thermal Anomalies (STA) - Mask layer. This layer is derived using the cumulative active fire detections data from the Moderate Resolution Imaging Spectroradiometer (MODIS) aboard the Terra and Aqua platforms as well as the 375m S-NPP VIIRS active fire detection data for calendar year 2023. 

The centroids of the active fire detections are summarized on a 400m grid, and any grid cell containing 5 or more active fire detections over the course of 2023 is extracted and the centroid of the grid cell buffered to approximate a 375m pixel size and smoothed to create a mask of frequently observed or static thermal activity. This mask is then filtered using multiple sources of data obtained from authoritative sources that inventory the locations of industrial heat sources and other natural heat sources not associated with the combustion of vegetation. 

The final output layer, the Static Thermal Anomalies - Mask, represents a provisional data layer with polygon features defining the approximate geographic extent of thermal activity, detected on a semi-persistent to persistent basis during the calendar year, that are associated with documented industrial heat sources or natural heat sources not related to vegetation fires.

Combining Data Sources to Pinpoint Active Fires

To assist users in identifying detected fires or other thermal activity not associated with the controlled or uncontrolled burning of vegetation, the FIRMS team dynamically analyzes all sources of polar-orbiting active fire detection data—including MODIS, the Visible Infrared Imaging Radiometer Suite (VIIRS), and the Operational Land Imager (OLI) aboard Landsat 8—with the Static Thermal Anomalies – Mask to tag detected activity that is likely associated with industrial heat sources or other types of natural heat sources. These dynamically identified detections are represented in the Static Thermal Anomalies - Detections layer and represent probable fires or other heat sources not associated with vegetation fires for the current date range displayed in the FIRMS Fire Map that has been defined by the user.
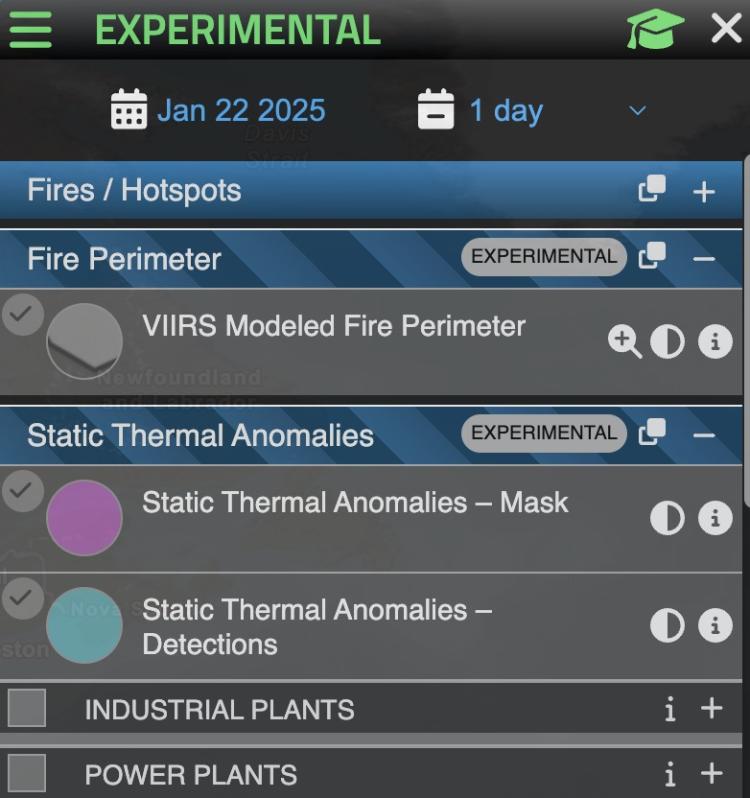
Experimental Mode

The initial versions of both the Static Thermal Anomalies - Mask and Static Thermal Anomalies - Detections layers are currently provided within FIRMS in the “Experimental Mode” under the Static Thermal Anomalies accordion. The layers from the authoritative sources that contain the locations of industrial heat sources and other natural heat sources, and which were used to filter the Static Thermal Anomalies – Mask, are also provided for reference under the “Industrial Plants” and “Power Plants” accordions.

Image

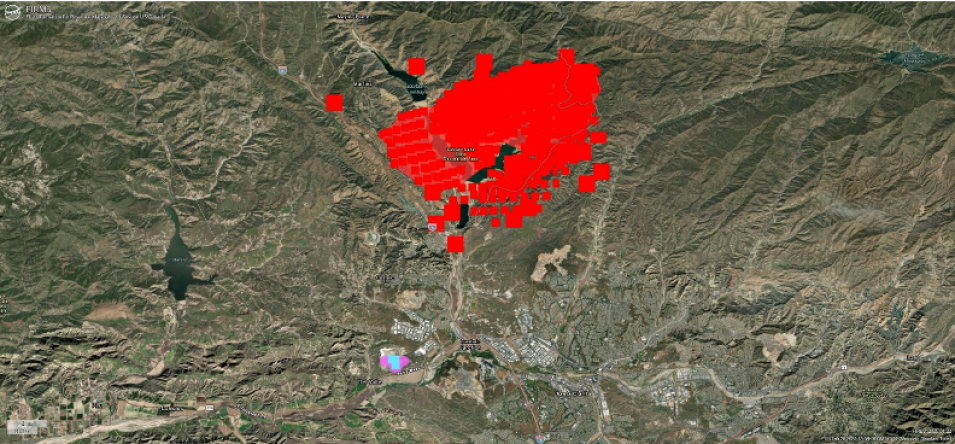
Figure 1 below provides an example of how these layers are used in the FIRMS Fire Map viewer. This example shows the Hughes Fire in California which started at approximately 11:00 a.m. PST on January 22, 2025, and burned the area surrounding Castaic Lake (red detections). The Static Thermal Anomalies - Detections layer also indicates detected fire activity (cyan) in the southwest corner of the map that occurred in the overnight hours of January 23 associated with a landfill to the northwest of Santa Clarita. 

Image
Image Caption

Figure 1: FIRMS imagery shows the Hughes Fire active fire detections occurring during January 22, 2025 (red); Static Thermal Anomalies - Detections from the overnight hours of January 22-23 associated with the landfill to the southwest (cyan); and Static Thermal Anomalies - Mask layer (pink).

The above detections are spatially associated with the Static Thermal Anomalies - Mask feature (pink polygon) encompassing that general area. The detected thermal activity is likely due to waste to energy creation activities conducted at the site, as noted in the World Resources Institute Power Plant Database, one of the industrial heat source datasets used by FIRMS to develop the Static Thermal Anomalies - Mask. Recent media stories also indicate the landfill has experienced issues in recent years with a persistent underground fire in a portion of the landfill which also may be a contributing factor for these detections. 

This combination of the Static Thermal Anomalies - Mask and Static Thermal Anomalies - Detections layers allows FIRMS users to discern that the detected fire activity in the southwest corner of the map is related to these documented activities at the landfill and not associated with the Hughes Fire approximately 9 km to the north.

These initial versions of the Static Thermal Anomalies - Mask and Static Thermal Anomalies - Detections layers will continue to be further refined and improved. NASA FIRMS accepts no responsibility for the accuracy and comprehensiveness of the industrial/natural heat source data and, consequently, users should review available metadata about these data available from the data source links provided in the FIRMS layer information and apply appropriate caution when using them or derived Static Thermal Anomalies - Detections data.

Details

Last Updated

Published