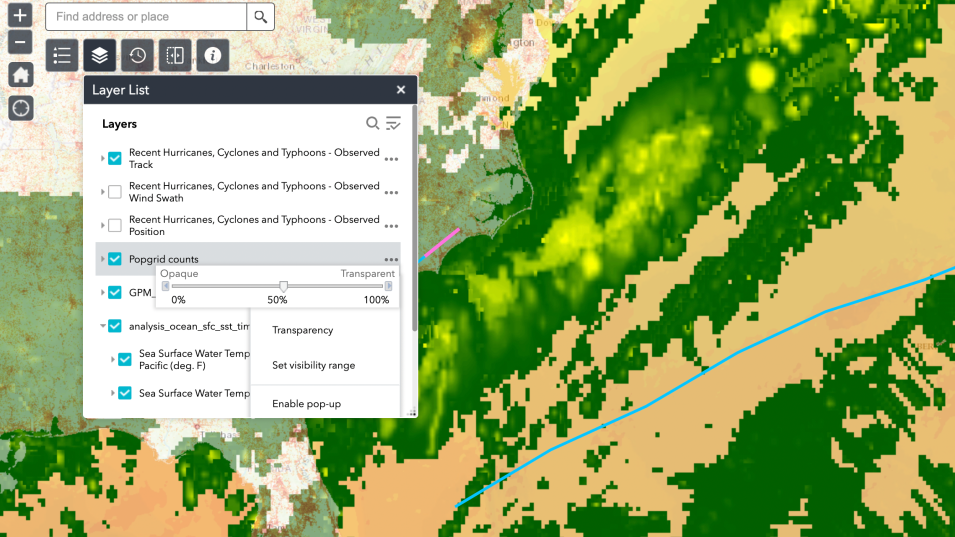
August through October is generally the peak of the Atlantic hurricane season, a time when ocean temperature is warmest through the Caribbean, the Gulf of Mexico, and along the U.S. Southeast and East Coast. A new tropical storms geographic information system (GIS) web application enables users to overlay data layers from NASA, NOAA, the National Hurricane Center, and other data providers for a deep dive into tropical storm-related data for recent storms, including socioeconomic information about populations that might be impacted by these storms.
GIS Tropical Storms App Provides Information About Recent Storms

Image from the GIS Tropical Storm App showing the U.S. East Coast around 11 a.m., EDT, on August 23, 2022. Pink/blue lines indicate the track and intensity of recent tropical storms. Green/yellow colors indicate current IMERG precipitation rate. Red dots along U.S. East Coast indicate population density. Orange color of ocean indicates warm ocean temperature. Credit: NASA ESDS/EGIST.
GIS allows for the integration and collective analysis of geospatial data from multiple sources, including satellite imagery, GPS recordings, and textual attributes associated with a particular space. Layers available in the tropical storms app include:
- Recent Hurricanes, Cyclones, and Typhoons Observed Track, Position, and Wind Swath: Provided by NOAA, the National Hurricane Center, and Esri, these layers display the distribution of recent events
- Precipitation: Shows the most recent available precipitation rate from the Integrated Multi-Satellite Retrieval for Global Precipitation Measurement (IMERG) Early run created from data acquired by the joint NASA/Japan Aerospace Exploration Agency (JAXA) Global Precipitation Measurement (GPM) satellite constellation
- Population Density: The Gridded Population of the World, Version 4 (GPWv4), available through NASA’s Socioeconomic Data and Applications Center (SEDAC), shows population density estimates
- SMAP Soil Moisture Anomaly: Data from NASA’s Soil Moisture Active Passive (SMAP) mission and surface soil moisture models indicate areas that may be more prone to flooding from storm surges
- Ocean Surface Temperature: Provided by NOAA/National Weather Service (NWS)/National Centers for Environmental Protection (NCEP) operational Near-Sea Surface Temperature (NSST) analysis, and the NASA Short-term Prediction and Transition Center (SPoRT) experimental North American Sea Surface Temperature Composite, this layer shows areas of warm ocean temperatures that fuel tropical storms
- Imagery: The Visible Infrared Imaging Radiometer Suite (VIIRS) layer showcases the near real-time (NRT) and event-based capabilities of NASA GIS data
The vision of NASA’s Earth Science Data Systems (ESDS) Program is to identify and deliver high value Earth science data in formats compliant and compatible with GIS standards; to ensure data are interactive, interoperable, accessible, and GIS-enabled through primary GIS platforms; and to provide the maximum impact to research, education, and public user communities requiring data visualization and spatial analysis. NASA’s ESDS Geographic Information Systems Team (EGIST) provides sustained support across ESDS to enable the appropriate use and adoption of GIS technology in support of Earth science research and applied science.