Why Do Fires on NASA's Maps Sometimes Look Bigger Than They Really Are?

Satellite-based maps offer quick first alerts and approximate locations of potential wildfires that are then precisely tracked and fought by teams on the ground.

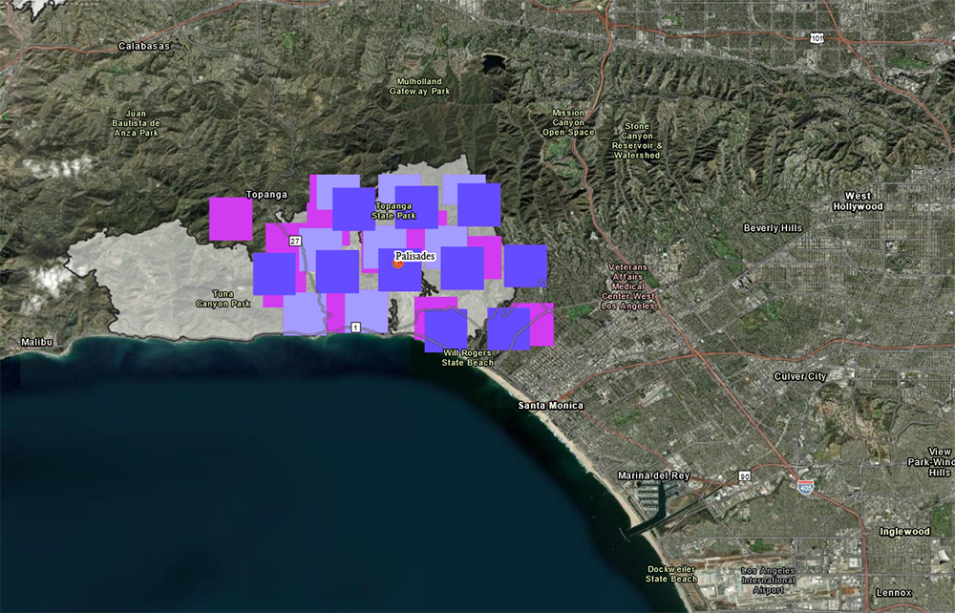
When the Palisades fire first became visible in the hillsides near Los Angeles, CA, on Jan. 7, it also soon appeared as large, brightly-colored pixel squares on wildfire detection maps that were displayed in the advanced mode of NASA’s Fire Information Resource Management System (FIRMS). The fire was still relatively small at that time, but on the map it already looked massive because of the size and number of squares shown. Why did the fire look so big on the map if at the time it was still sparse or small?

“We were looking at the map and initially wondering if the fire footprint was really that big, and we often hear the same question from researchers and members of the public in these situations,” said Diane Davies, operations manager for NASA’s Land, Atmosphere Near real-time Capability for Earth observation (LANCE) project, which houses FIRMS.

Davies said the short answer is that often some of the initial fire hotspot alerts come from satellites that provide early awareness and initial alerts on a potential fire location. These alerts can quickly inform emergency response teams so that they can more precisely assess what is likely a rapidly changing situation.

This rectangular image shows the location of satellite-based fire detection targets overlaid on visible imagery of the Los Angeles area landscape. In the center of the image over Pacific Palisades, CA, are nearly 30 pink, light purple, and purple squares showing the location of suspected fires.
Image Caption

This image shows the first satellite-based fire detections in Pacific Palisades, CA, as they appeared on the FIRMS US/Canada map on Jan. 7, 2025. Credit: NASA FIRMS.

Time-Critical Detections

The longer answer has to do with the satellites that detect the fire, their speed in imaging terrain, and the resolution of their instruments. 

The Palisades fire was first detected by NOAA’s GOES-16 and 18 weather satellites hovering over the United States in geostationary orbit. The satellites stand watch from orbit capturing images of the U.S. every 10 minutes with its Advanced Baseline Imager (ABI), allowing them to see a fire very soon after it starts.

“Geostationary data, such as from GOES, is often used as a first, initial source for identifying fires because of its immediate availability,” said Jenny Hewson, the outreach and implementation manager for LANCE.

That said, imaging land still takes precious time in these sorts of emergencies—and doing it in fine detail takes even longer. Once a fire starts, time is critical. Because the GOES satellites provide continuous observations, their spatial resolution is a relatively coarse 2 kilometers (km) per pixel when looking directly below the satellite, which limits the level of detail they can show. To visualize the effect of this, imagine an image of the Pacific Palisades area being divided into a grid of 2 km squares. Each pixel in the ABI instrument corresponds with one of those squares. Anything seen in the pixels corresponding to those squares smaller than 2 km in size will be too blurry to be clearly seen, making it difficult to identify and measure the exact dimensions and position of a fire. 

To make finding and roughly locating fires a lot easier, they’re spotted in the imagery using fire-detecting computing algorithms that scan each pixel for the sometimes subtle kind of light, heat, and other signals of a fire. If fire is suspected within the pixel’s 2 km coverage, the pixel square is flagged and a 2 km-wide colored block labeled as fire is added to the map. So, there could be just a small, intense spot fire located anywhere within that pixel, but if it’s bright and visible enough to be seen from space, the entire 2 km area on the map is labeled as a suspected fire. Again, this is because we can’t be sure of the exact location of anything smaller than 2 km due to the satellite’s resolution. 

If the same small fire is found in an area bordering multiple pixels, all of the pixels will be labeled. For example, a small fire in an area bordering where four square pixels meet could be flagged as four pixels large or 4x4 km in size. Yes, the area flagged could be larger than the actual fire, but it’s safer to over- rather than underestimate the size of fire when first responding to it. And what if a fire is 2 km or larger? It will be flagged with the number of squares large enough to encompass it and approximate its location.
This image illustrates how detected fires can appear in the individual pixels of a sensor. Fires are plotted into four pixel squares that are stacked two tall and two wide. On the left, a single fire appearing in the middle of a single pixel registers as one fire. In the middle of the image, two fires are shown within a single pixel but only register as one fire. On the right side, a fire sitting in the middle intersection of four pixels squares registers as covering all four pixels.
Image Caption

This graphic depicts pixels flagged as containing one or more potential fires. The hotspot “location” is the center point of the pixel, which is not necessarily the coordinates of the actual fire. Credit: NASA FIRMS.

This same general scenario applies to instruments on other platforms used for fire detection, such as the Moderate Resolution Imaging Spectroradiometer (MODIS) aboard the Aqua and Terra satellites, and the Visible Infrared Imaging Radiometer Suite (VIIRS) on Suomi-NPP, NOAA 20, and NOAA 21.

Sharing Data to Fight Fires

When pixels are flagged and fires are found using the ABI, MODIS, or VIIRS instruments, they are added as they become available to FIRMS maps, email alerts, web services products, and analysis-ready data. From there, local firefighting personnel, decision-makers, and other users of the data will confirm the location of new fire ignitions and their position using various methods such as spotter and firefighter reports, video surveillance of fire-prone areas, and airborne reconnaissance flown over the scene of a suspected wildfire. Firefighters continue to use active fire detection data satellite observations acquired at high frequency to monitor the progression of fires and their intensity over the life of an event to inform strategic response and planning decisions. Infrared imagery captured by aircraft are also routinely acquired during an incident to support fire management activities.

“The infrared imagery collected by aircraft is typically about four meters spatial resolution, and gathered overnight when its cooler to get better discrimination between the background and where the fire is,” said Brad Quayle, lead for the Disturbance Assessment and Services Program at the USDA Forest Service’s Geospatial Technology and Applications Center. “The imagery is then interpreted by image analysts to create tactical-scale fire maps to inform decisions and planning for how and where to use of suppression assets to fight the fire.”

To give users an improved ability to see a fire’s true size, FIRMS is also experimenting with computer modeling to more precisely estimate the footprint of fires. Users can access this feature by selecting the “Experimental” button inside the Main Map Menu to see a VIIRS modeled fire perimeter of the Palisades blaze.

Details

Last Updated

Published