We are in the process of migrating all NASA Earth science data sites into Earthdata from now until end of 2026. Not all NASA Earth science data and resources will appear here until then. Thank you for your patience as we make this transition.
Read about the Web Unification Project
HS3 Learning Resources
Webinars, tutorials, data recipes and more to help you work with HS3.
Learn
Filters
Learn how to generate a time-height plot of the measured Hurricane and Severe Storm Sentinel (HS3) High-Altitude Imaging Wind and Rain Airborne Profiler (HIWRAP) radar reflectivity through a Python plotting routine.
Data Recipe
Dec. 2, 2022
This data recipe enables users to plot temporal subsets of the HS3 High Altitude MMIC Sounding Radiometer (HAMSR) Radar Reflectivity Profiles through a Python plotting routine.
Data Recipe
Dec. 1, 2022

This data recipe instructs users on how to generate vertical time-height plots of Hurricane and Severe Storm Sentinel (HS3) Global Hawk Cloud Physics Lidar (CPL) attenuated total backscatter measurements using a Python plotting routine.
Data Recipe
Dec. 1, 2022
Join us for an interactive overview of tools and resources at NASA's Global Hydrometeorology Resource Center DAAC for accessing data related to hazardous weather, its governing dynamical and physical processes, and associated applications.
Webinar
April 19, 2022
Join us on Wednesday, 24 February 2016, 2-3pm to learn how the new Field Campaign Explorer tool serves up mission flight information, instrument status, weather reports, and summary statistics in support of field campaign science data.
Webinar
April 14, 2022
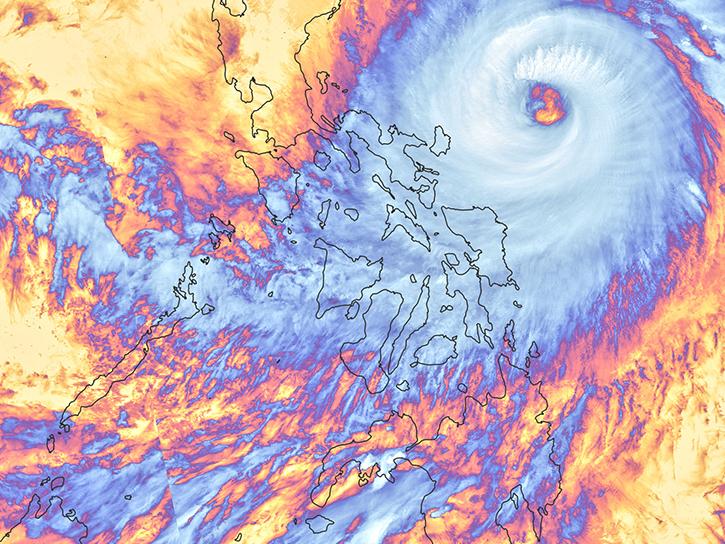
The Hurricane and Severe Storm Sentinel (HS3) field campaign helped researchers identify areas of heavy rain and wind within Ingrid ahead of landfall.
Data in Action
Nov. 15, 2018
SHOWING 6 OF 6