Description
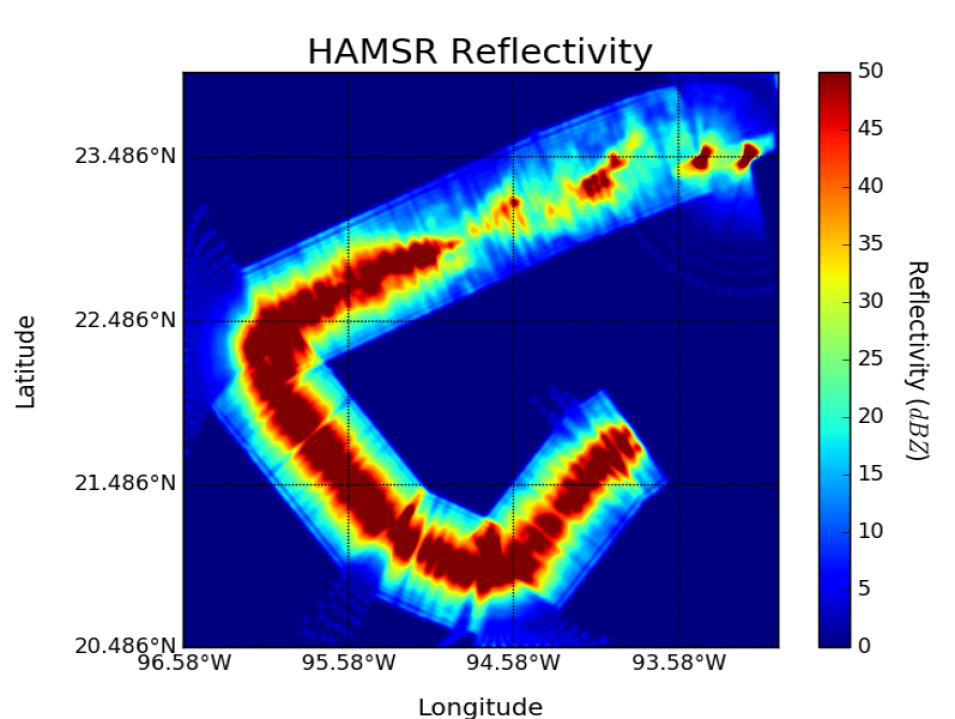
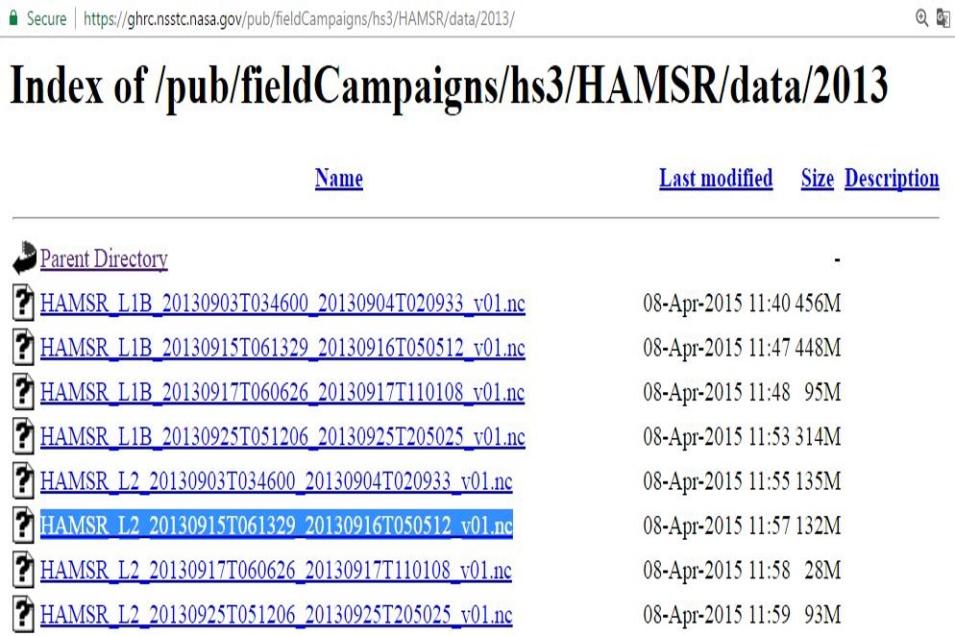
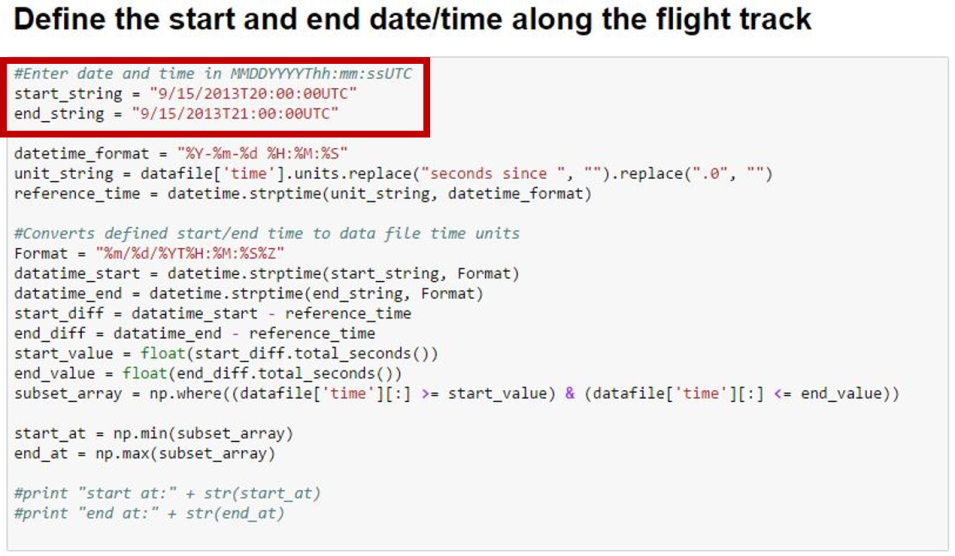
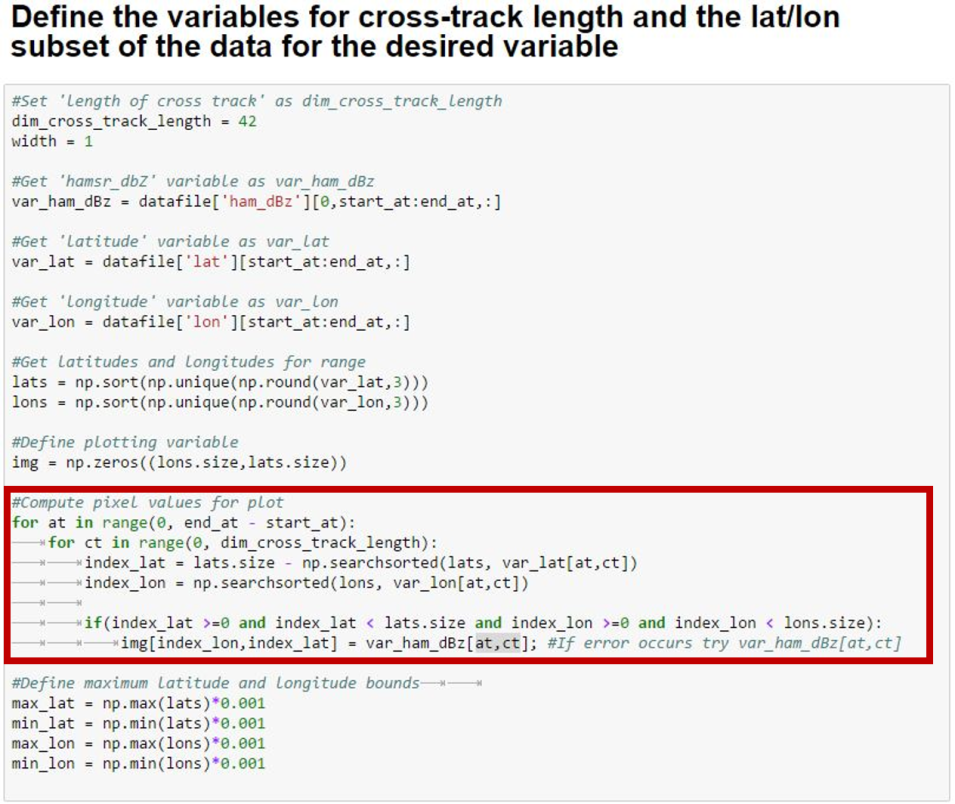
This data recipe enables users to plot temporal subsets of the HS3 HAMSR Radar Reflectivity Profiles through a Python plotting routine. The routine requires users to define a HS3 HAMSR L2 data file and time period of interest along a HS3 flight track. The Python script extracts the user defined temporal subset from the specified HAMSR data file through OPeNDAP, then plots the data to provide a quick visualization of radar reflectivity. Advanced users may alter the code to plot additional variables provided within the HAMSR data files, or use the iPython Notebook version.


