satellite image of hurricane Irma
clouds over the Black Sea
satellite image of hurricane data

HS3

Hurricane and Severe Storm Sentinel

The Hurricane and Severe Storm Sentinel (HS3) was a NASA airborne field campaign focused on better understanding the physical processes that control hurricane intensity change. HS3 helped to answer questions related to the roles of environmental conditions and internal storm structures to storm intensification. 

Due to the nature of the questions that HS3 mission addressed, it involved a variety of in-situ, satellite observations, airborne data, meteorological analyses, and simulation data. HS3 was a 5-year mission with three observation years (2012, 2013, and 2014). The primary aircraft used in the campaign were two high altitude, long-duration flight unmanned airborne systems (UAS).  Each Global Hawk UAS was outfitted with instruments capable of measuring various storm and environmental parameters.

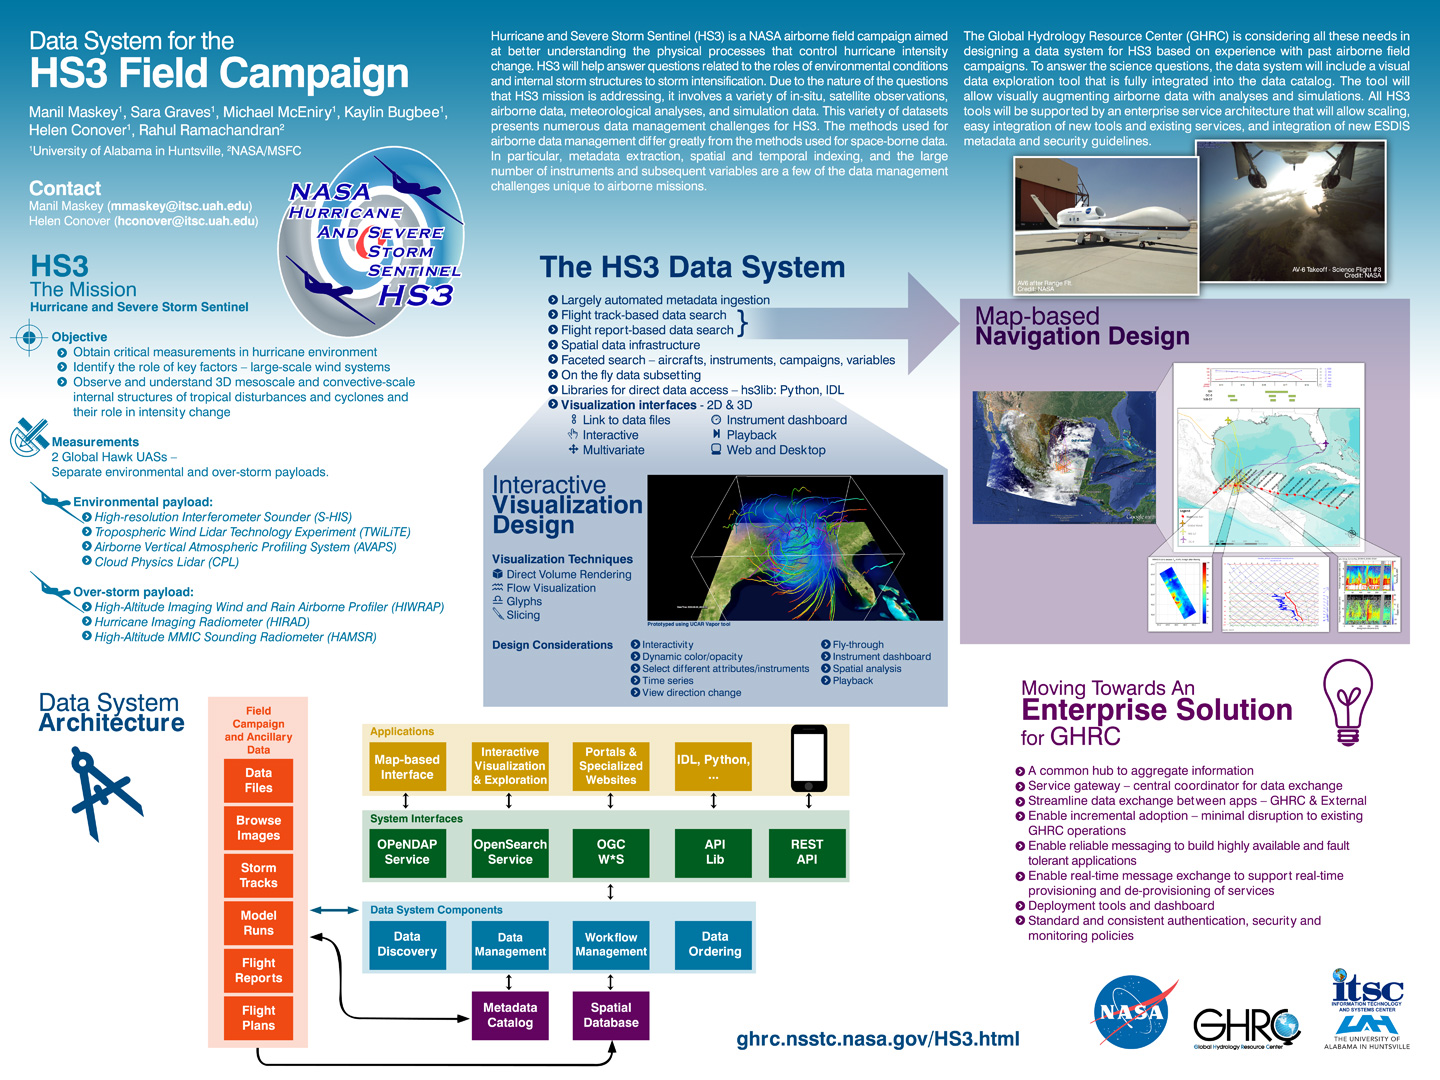
Discovering answers to the following science questions was the primary project goal.
 
For the Environment:
 
  • What impact does the Saharan air layer (SAL) have on intensity change?
  • How do storms interact with shear produced by large-scale wind systems?
  • How does the outflow layer interact with the environment?
 
For the Storm Inner core:
 
  • What is the role of deep convective towers (bursts) in intensity change? Are they critical to intensification?
  • What changes in storm structure occur prior to and during genesis and rapid intensification?
  • How do intrusions of dry air impact intensity change?

The primary objectives included:

  • Assessing the relative roles of large-scale environment and storm-scale internal processes
  • Addressing the role of the Saharan Air Layer (SAL) in tropical storm formation and intensification
  • Assessing the roll of deep convection in the inner-core region of storms


This image shows the flight tracks of the NASA GlobalHawk (GH) unmanned aircrafts flown during the NASA Hurricane and Severe Storm Sentinel (HS3) field campaign (2012,2013,2014). Extensive coverage of the Atlantic Ocean could not have been done with conventional aircraft.
Image Caption

This image shows the flight tracks of the NASA GlobalHawk (GH) unmanned aircrafts flown during the HS3 field campaign (2012, 2013, and 2014). Extensive coverage of the Atlantic Ocean could not have been done with conventional aircraft.

Study DatesSeptember 6, 2012 - October 17, 2014
Season of StudyBoreal fall, boreal summer
RegionSubtropical Atlantic Ocean and Gulf of Mexico
Spatial Bounds

N: 52°

W: -120°

E: -60°

S: 12°

Phenomena StudiedHurricanes
HS3 outfitted two Global Hawk unmanned aircrafts to perform in two separate environments: near the storm and over the storm. The BAMS HS3 Publication by Braun et al (2016) contains a detailed listing of the instruments and flights operated during the campaign. The instruments were used to observe either the tropical cyclone environment or inner-storm characteristics providing insight into storm development.

Five instruments were mounted on one or the other of the two Global Hawk UAS aircraft, and each measured the atmosphere from flight altitude. A sixth, the Automated Vertical Atmospheric Profiling System (AVAPS) on the environment Global Hawk, is unique in that it contained hardware mounted on the aircraft for automated release of dropsondes which measured the atmospheric characteristics of temperature, pressure, humidity and winds during their descent. Up to 88 dropsondes could be released on each Global Hawk flight. These dropsonde data were essential for validation activities.

Platform TypePlatformRelevant InstrumentHow are the Data Used?
AirborneGlobal Hawk UAV

HIWRAP

HIRAD

AVAPS

CPL

HAMSR

S-HIS

Tropical cyclone development

Tropical cyclone environment

Atmospheric temperature

Atmospheric humidity

Atmospheric Winds

Timeline of HS3 events of interest
Image Caption

The above timeline highlights events within the field campaign of particular scientific interest.

The HS3 field campaign dataset consisted of various support data collected during the campaign observation periods, including:
 
  • World Wide Lightning Location Network (WWLLN) lightning data for the observed storms
  • Statistical Hurricane Intensity Prediction Scheme (SHIPS) model data
  • NASA Global Modeling and Assimilation Office (GMAO) Dust Aerosol Optical Thickness (AOT) data
  • Various satellite data obtained from the Naval Research Lab cropped to storm locations
  • Cloud top height, overshooting tops, and brightness temperatures from the Cooperative Institute for Meteorological Satellite Studies (CIMSS)

Aircraft navigation data, instrument reports and flight reports are included in the collection. These additional data contain satellite imagery, instrument retrieval plots, and maps of flight tracks and dropsonde locations.

A specialized data system was developed for HS3 that simplified access to the many heterogeneous data included in the campaign collection. A tool, called the Field Campaign Explorer (FCX), was developed  for visual data exploration and was integrated into the data system catalog. FCX was built to allow for visually augmenting airborne data with analyses and simulation data to address the important  science questions. Learn more about FCX in the webinar FCX: A Science Enabling System for Visualizing and Analyzing Earth Science Data.

The HS3 data system architecture is shown below.

A multicolor diagram of the HS3 Data System Architecture
Image Caption

HS3 data system architecture

In September 2014, the Global Hawk flights of Hurricane Edouard captured a period of significant intensification. Data collected by both the instruments onboard the Global Hawk UAV and the AVAPS dropsondes released from the aircraft suggest that Edouard then weakened during the eyewall replacement cycle. The intensification and subsequent weakening were also seen in GOES imagery. The rapid variations in intensity occurred on much shorter time scales than those of the best-track data record.

Hurricane Nadine (September 2012) was the best chance for HS3 to study interactions between the Saharan Air Layer (SAL) and tropical cyclones. HS3 captured interaction of Nadine with the SAL that corresponded with two dust outbreaks exiting the Sahara. The CPL and the Scanning High-Resolution Interferometer Sounder (S-HIS) instruments detected a deep SAL within Hurricane Nadine’s northeastern quadrant revealed by its very hot and dry conditions lower in the layer and cooler, moister conditions near the top of the dust layer. It was not possible, however, to determine the impact of the SAL on Hurricane Nadine. 

The outflow of a tropical cyclone can play a role in a hurricane’s Maximum Potential Intensity (MPI). It is assumed that outflow stratification is the result of internal dynamics and small-scale turbulence which limits the Richardson number (Ri). The Ri expresses the ratio of buoyancy and wind shear. During HS3, the global hawk provided high-density coverage of the outflow layer, including a lower-stratospheric layer of low Ri, characterized by strong shear and higher stability not previously measured with typical dropsondes.

HS3 also obtained data useful for the study of the structure of the Saharan Air Layer and the environmental processes involved in determination of which systems fail to develop into hurricanes.

Field Campaign Publication

Braun, S.A., P.A. Newman, et al. (2016). NASA’s Hurricane and Severe Storm Sentinel (HS3) Investigation. BAMS, November 2016, 2085-2102. doi:10.1175/BAMS-D-15-00186.1

HS3 Notable Publications

Abarca, S.F., M.T. Montgomery, et al. (2016). On the Secondary Eyewall Formation of Hurricane Edouard (2014). Monthly Weather Review, 144, 3321-3331. doi:10.1175/MWR-D-15-0421.1 
 
Komaromi, W.A. and J.D. Doyle (2017). Tropical Cyclone Outflow and Warm Core Structure as Revealed by HS3 Dropsonde Data. Monthly Weather Review, 145, 1339-1358. doi:10.1175/MWR-D-16-0172.1
 
Maskey, M., M. McEniry, et al. (2014). Data System for HS3 Airborne Field Campaign.
 
Munsell, E.B., J.A. Sippel, et al. (2015). Dynamics and Predictability of Hurricane Nadine (2012) Evaluated through Convection-Permitting Ensemble Analysis and Forecasts. Monthly Weather Review, 143, 4514-4532. doi:10.1175/MWR-D-14-00358.1 
 
Munsell, E.B., F. Zhang, et al. (2017). Dynamics and Predictability of the Intensification of Hurricane Edouard (2014). Journal of the Atmospheric Sciences, 74, 573-595. doi:10.1175/JAS-D-16-0018.1
 
Raymond, D.J. (2016). The effects of moist entropy and moisture budgets on tropical cyclone development. Journal of Geophysical Research, 121:16, 9458-9473. doi:10.1002/2016JD025065
 
Rogers, R.F., J.A. Zhang, et al. (2016). Observations of the Structure and Evolution of Hurricane Edouard (2014) during Intensity Change. Part II: Kinematic Structure and the Distribution of Deep Convection. Monthly Weather Review, 144, 3355-3376. doi:10.1175/MWR-D-16-0017.1 
 
Zawislak, J., Haiyan J., et al. (2016). Observations of the Structure and Evolution of Hurricane Edouard (2014) during Intensity Change. Part I: Relationship between the Thermodynamic Structure and Precipitation. Monthly Weather Review, 144, 3333-3354. doi:10.1175/MWR-D-16-0018.1
 

Background Hurricane Information

Bender, M.A. (1997). The Effect of Relative Flow on the Asymmetric Structure in the Interior of Hurricanes. Journal of the Atmospheric Sciences, 54, 703-724. doi:10.1175/1520-0469(1997)054%3C0703:TEORFO%3E2.0.CO;2 
 
Braun, S.A. (2010). Reevaluating the Role of the Saharan Air Layer in Atlantic Tropical Cyclogenesis and Evolution. Monthly Weather Review, 138, 2007-2037. doi:10.1175/2009MWR3135.1 
 
Didlake, Jr., A.C., G.M. Heymsfield, et al. (2015). The Coplane Analysis Technique for Three-Dimensional Wind Retrieval Using the HIWRAP Airborne Doppler Radar. Journal of Applied Meteorology and Climatology, 54, 605-623. doi:10.1175/JAMC-D-14-0203.1
 
Kaplan, J. and M. DeMaria (2003). Large-Scale Characteristics of Rapidly Intensifying Tropical Cyclones in the North Atlantic Basin. Weather and Forecasting, 18, 1093-1108. doi:10.1175/1520-0434(2003)018%3C1093:LCORIT%3E2.0.CO;2
 
Kelley, O.A., J. Stout, et al. (2005). Tall precipitation cells in tropical cyclone eyewalls are associated with tropical cyclone intensification. Geophysical Research Letters, 31(24), L24112. doi:10.1029/2004GL021616 
 
Molinari, J. and D. Vollaro (2010). Rapid Intensification of a Sheared Tropical Storm. Monthly Weather Review, 138, 3869-3885. doi:10.1175/2010MWR3378.1