We are in the process of migrating all NASA Earth science data sites into Earthdata from now until end of 2026. Not all NASA Earth science data and resources will appear here until then. Thank you for your patience as we make this transition.
Read about the Web Unification Project
GHRC DAAC Learning Resources
Webinars, tutorials, data recipes and more to help you work with GHRC DAAC.
Filters
This data recipe provides instructions on how to use a Python script to convert Infrared Global Geostationary Composite McIDAS data into PNG format and display the infrared composite as an image outside of McIDAS software.
Data Recipe
Oct. 2, 2024
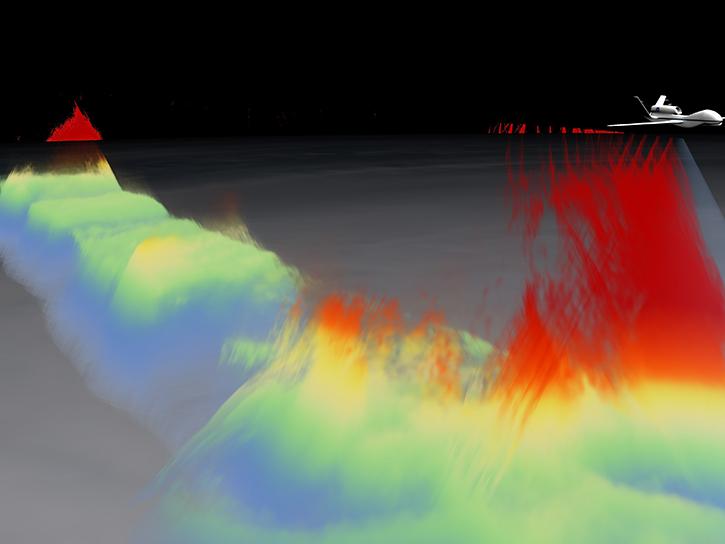
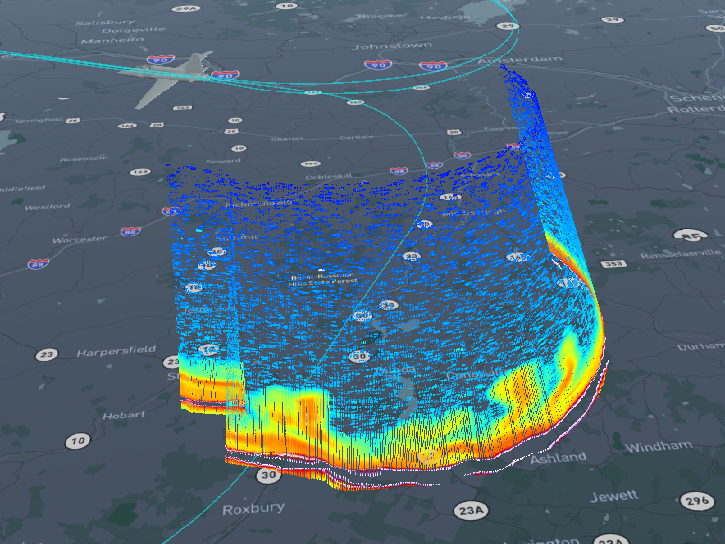
The Field Campaign Explorer (FCX) enables 3D analysis of Earth science datasets. This Earthdata webinar features use cases and information about this system.
Webinar
Sept. 26, 2024
Organized by the Airborne and Field Data Working Group, the Second Airborne and Field Data Workshop gathered input to improve the usability of airborne and field data, with a focus on tools and standards.
Event
March 4, 2024
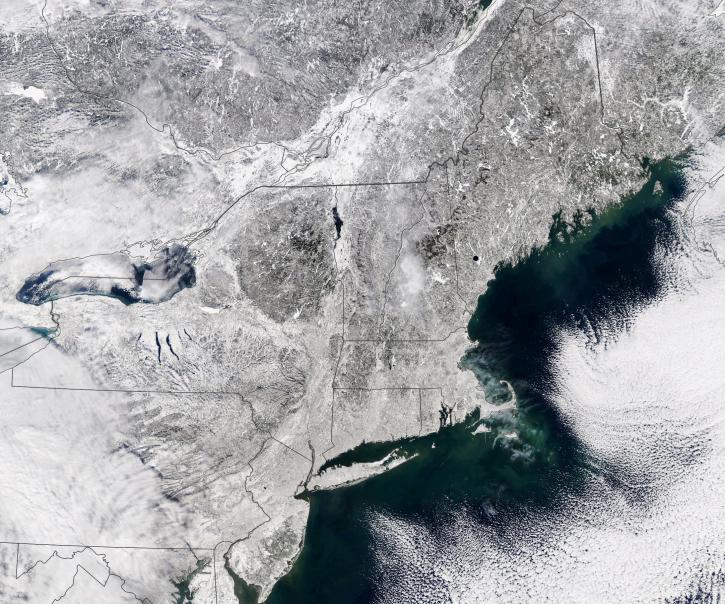
Join us on October 24, 2023, for the fourth Data User Workshop for Investigation of Microphysics and Precipitation for Atlantic Coast-Threatening Snowstorms (IMPACTS).
Event
Oct. 24, 2023
This webinar provides a demonstration of using NASA's Catalog of Archived Suborbital Earth Science Investigations (CASEI) for exploring past and present airborne and field campaign platforms, instruments, geophysical concepts, and data products.
Webinar
Aug. 10, 2023
This training will cover how soil moisture is modeled within LIS in to improve drought monitoring.
Training
May 17-31, 2023
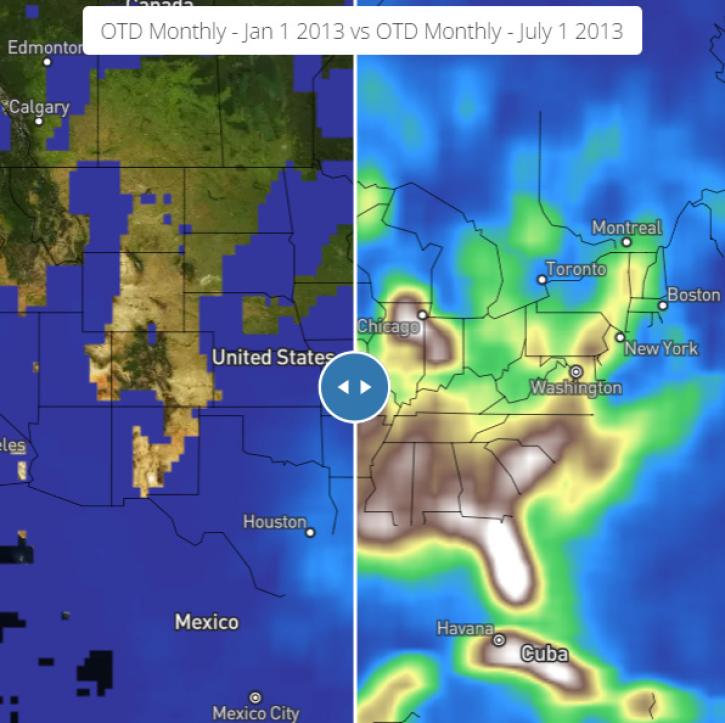
Join us May 3 at 2 p.m., EDT [UTC -4], to learn how to use the Lightning Dashboard at NASA's Global Hydrometeorology Resource Center Distributed Active Archive Center (GHRC DAAC) to visualize and analyze NASA's lightning data.
Webinar
April 26, 2023
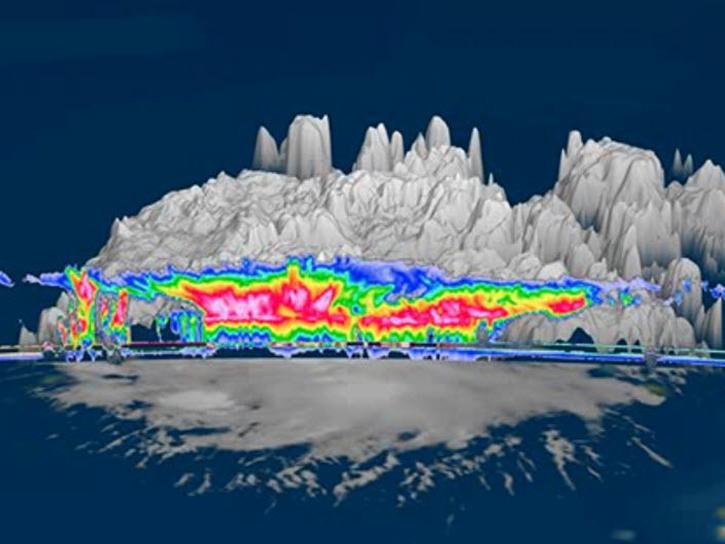
Learn how to generate time-height plots of measured Cloud Radar System radar reflectivity and Doppler velocity through a Python 3 plotting routine.
Data Recipe
Jan. 9, 2023
