Step 5
When the script is first run, the code will ask you which CRS campaign dataset you would like to plot. In this example we will plot data from the GOES-R PLT field campaign, therefore we entered “2” for the campaign number.
Select the CRS campaign dataset you would like to plot from the list below.
Campaign #1: impacts
Campaign #2: goesrplt
Campaign #3: olympex
Campaign #4: iphex
*Enter Campaign Number or 'Q' to quit: 2
Step 6
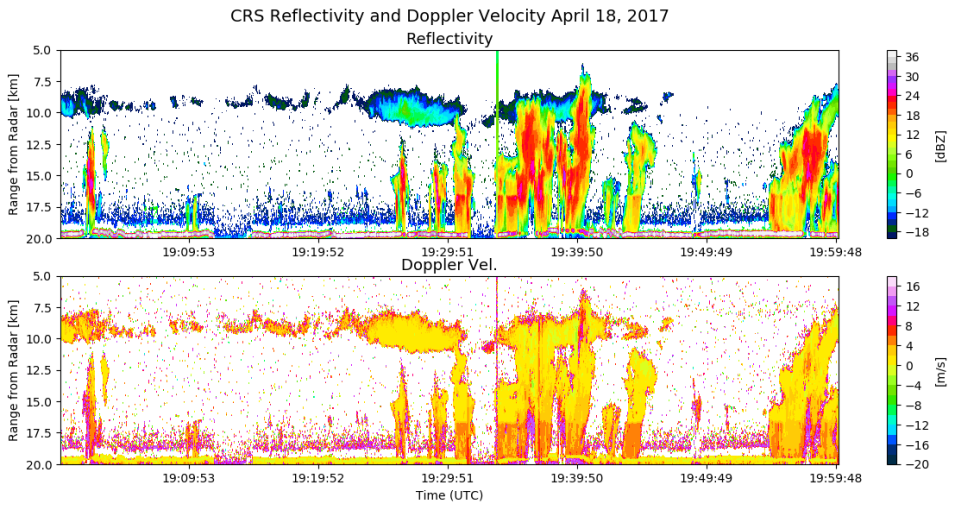
It will then ask which flight period you would like to plot. There was only one GOES-R PLT data file in the directory for this example, therefore there is one option for GOES-R PLT flight dates. The flight date “April 18, 2017” was selected.
The goesrplt campaign is selected
Flight Dates:
2017-04-18
*Enter date in [yyyy-mm-dd] or Q to quit:2017-04-18
Step 7
Next, the code will give you the option to plot a subset or the entire flight period. For this example we will plot a subset. When plotting a subset, the code asks for the desired subset starting time. For the plot displayed in this tutorial, this time will be “19:00:00” UTC. (Note: For the IMPACTS dataset plotting routine, the code will ask the user to enter the starting date after asking for the starting time.)
Flight date 2017-04-18 is selected.
Flight time: 17:22:12.009888-22:30:03.003231 UTC, 2017-04-18
*Select subset starting in [hh:mm:ss] UTC:
or 'ALL' for entire flight:
or Q to quit:
19:00:00
Step 8
The code will then ask for the desired subset ending time. For the plot displayed at the beginning of this tutorial, the subset ending time will be “20:00:00” UTC. (Note: For the IMPACTS dataset plotting routine, the code will ask the user to enter the ending date after asking for the ending time.)
*Select subset ending in [hh:mm:ss] UTC
or Q to quit:
20:00:00
Step 9
The code will notify you when the plot figures have been generated for "reflectivity" and "Doppler velocity". The plot will display in the matplotlib figure window (Windows only) where it can be viewed. Once you close the plot display window, the code will ask whether you would like to save the plot.
Fig.0 is done for Ref
Fig.1 is done for DopV
*Save plot(y/n)?
If you enter “y” for “yes”, the code will save the PNG plot image to the same location where the CRS data files are located and display the path to this image file. If you enter “n” for “no”, the code will state that no image file was saved. In both cases, the code will return to the CRS campaign dataset selection step where you can either select another CRS dataset to plot or select “quit” to exit the code.
If instead, you would like to run the script inside your Python console, the following steps will guide you on this procedure.
Step 10
Open the Python environment installed on your computer and as previously noted, make sure the required Python packages outlined in the “How to Use” section are installed.
Navigate to the location on your computer where the “CRS_Recipe_Code.py” and “CRS_Recipe_Functions.py” files are saved and open the “CRS_Recipe_Code.py” file within your Python environment.
Step 11
At the very beginning of the “CRS_Recipe_Code.py” script is a header that describes the script’s function. Below the header, all of the required packages and subpackages are imported. Using your computer’s file explorer, navigate to the folder on your computer where you saved the CRS data files. From the address bar, copy the file path and paste it inside the quotations behind the “dirpath” variable. Change all of the backslashes (\) to forward slashes (/) in the path name. An example path is included in the script and shown in the image below.


