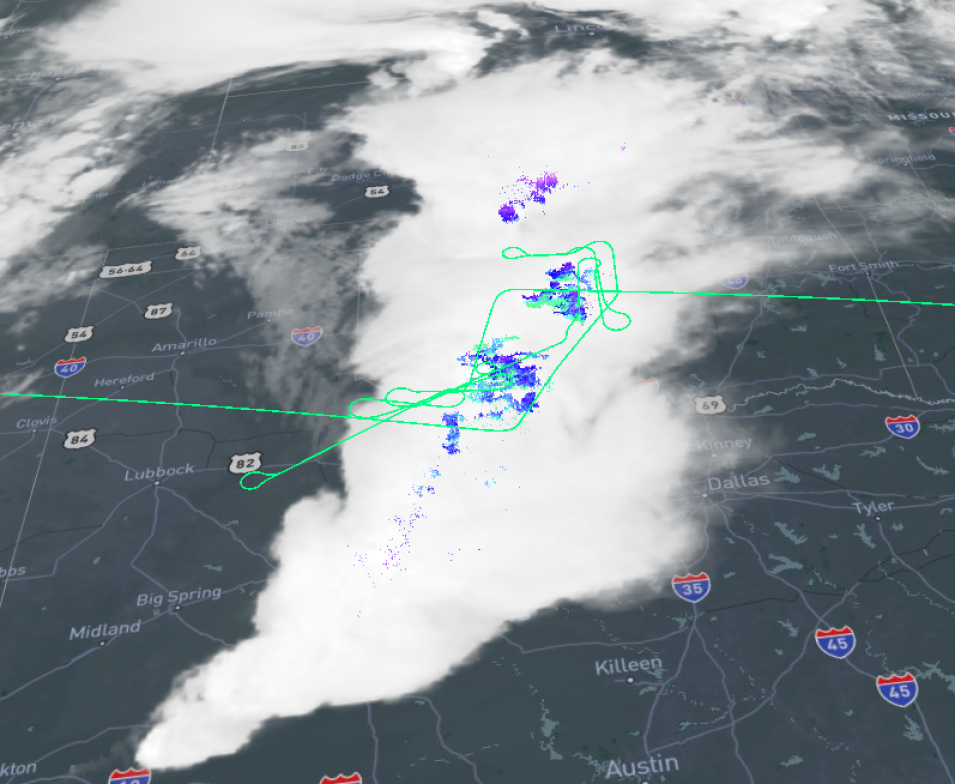
Visualization and data analysis are critical components of scientific research. The drive for research to be more interdisciplinary and the ongoing increase in volumes of data both pose numerous challenges. Large datasets need to be processed while, simultaneously, multiple three-dimensional datasets (such as lightning source observations from a lightning mapping array) need coincident visualization.
Coincident visualization refers to the ability to accurately plot geolocated datasets at the same time. The image below shows cloud cover from the Advanced Baseline Imager (ABI) instrument (white areas), source observations from the lightning mapping array (purple and blue colors), and the flight track of the ER-2 aircraft (green lines). Each of these data sources is overlaid on a map layer that provides political map details and major roads.
