NASA Earth Science Data Roundup: July 2023

A summary of datasets, products, and resources released by NASA’s Distributed Active Archive Centers (DAACs) in June 2023.
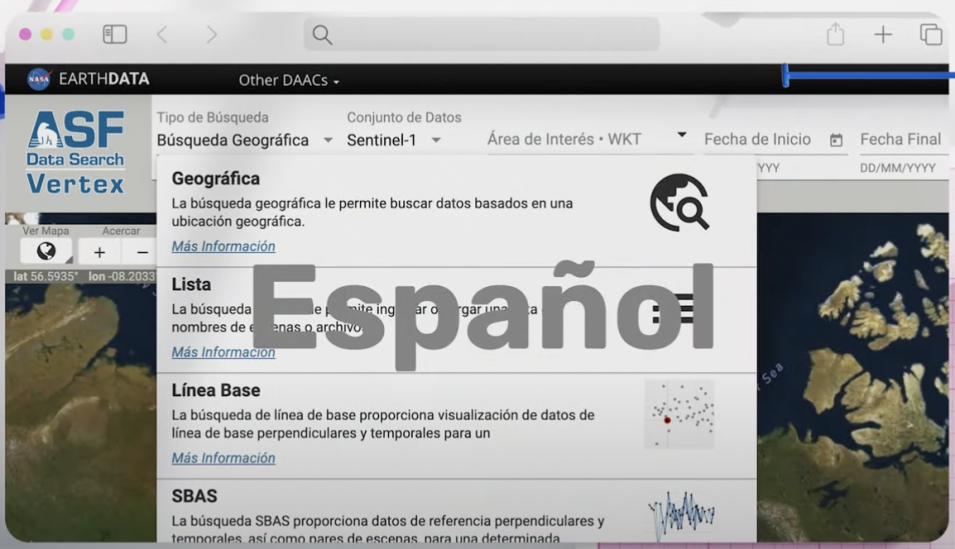
Vertex home page with word Espanol across front and all text in Spanish
Image Caption

Alaska Satellite Facility Distributed Active Archive Center (ASF DAAC)

ASF Vertex Data Search Now Available in Spanish

In response to user requests, a Spanish version of the ASF DAAC’s Vertex graphical search interface for finding synthetic aperture radar (SAR) data is now available.

Watch a video about having Vertex available in Spanish to learn more

Atmospheric Science Data Center (ASDC)

New CALIOP Level 2 Data Products

The Cloud-Aerosol Lidar and Infrared Pathfinder Satellite Observations (CALIPSO) mission team released V4.51 Level 2 Cloud-Aerosol Lidar with Orthogonal Polarization (CALIOP Lidar) data products. The new products feature several improvements to the characterization of smoke above clouds, single-shot (333-meter) cloud clearing techniques, and a stratospheric aerosol classification scheme. Also, two additional particulate optical depths are computed, derived over both ocean surfaces and above opaque water clouds. CALIPSO is a joint mission between NASA and the Centre National d’Etudes Spatiales (CNES, the French space agency), and launched on April 28, 2006, to study the roles of clouds and aerosols in climate and weather. CALIOP is one of three instruments aboard CALIPSO.

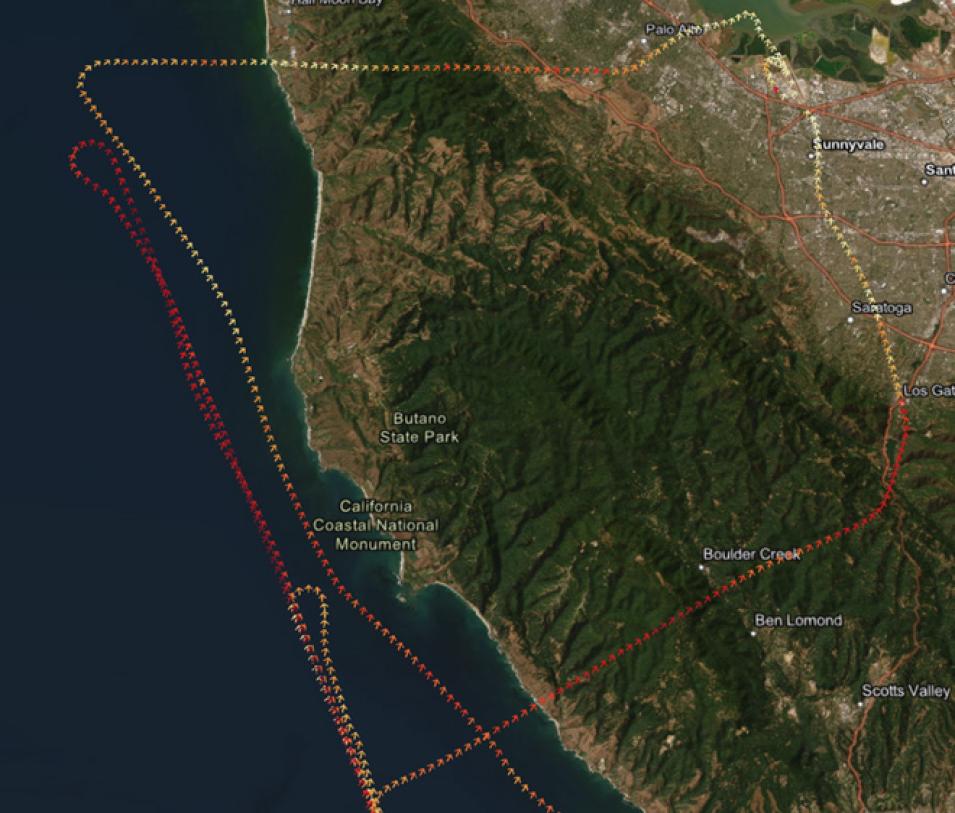
NASA Alpha Jet Atmospheric eXperiment (AJAX) airborne campaign Flight 181  flight path.
Image Caption

Colored arrows on this image indicate the flight paths of AJAX Flight 181 over northern California on March 10, 2016, along with wind speed and direction. Credit: AJAX.

CALIOP CALIPSO V4.51 Lidar Level 2 data product

New AJAX Data-in-Action StoryMap

The ASDC Suborbital Support team published a new StoryMap highlighting a publication from the Alpha Jet Atmospheric eXperiment (AJAX). The StoryMap explores the impact of terrain trapped airflows on the development of atmospheric rivers and provides an overview of the publication and interactive maps highlighting the datasets that were used to conduct the research. AJAX data collected during a flight on March 10, 2016, including ozone, methane, carbon dioxide, water vapor, and wind speed and direction, are plotted and visualized in the StoryMap. Data discovery and data access links to AJAX data also are provided.

Crustal Dynamics Data Information System (CDDIS)

New GNSS Real-Time Data Cluster System with Accompanying Stream Status Application Released

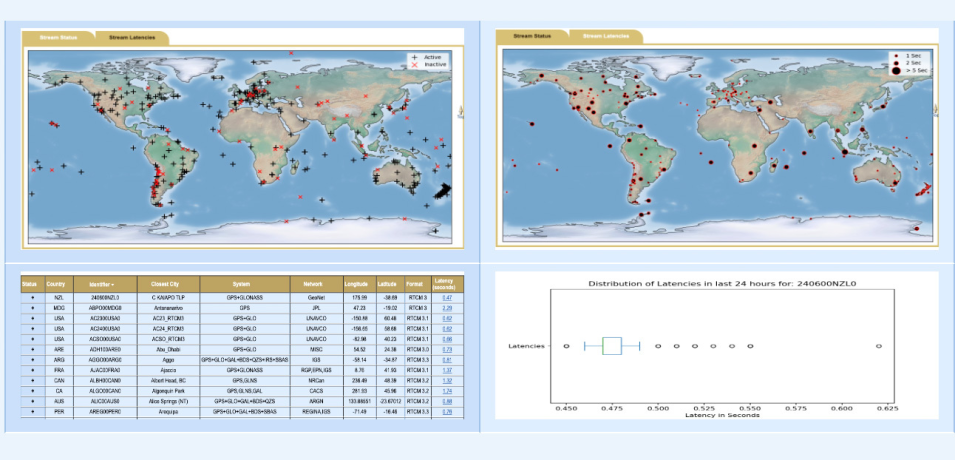
NASA’s CDDIS updated its Networked Transport of Radio Technical Commission for Maritime Services via Internet Protocol (NTRIP) global navigation satellite system (GNSS) to run on a multimode cluster architecture for increased performance and reliability. The real-time system, which became operational May 15, 2023, is used in a variety of science and societal areas, such as disaster response and tsunami and earthquake monitoring, and gives access to GNSS receiver data worldwide with latencies of less than one second. In addition, CDDIS has added a monitoring system that checks all streams every five minutes and reports on their status and latencies. Data are displayed in both a table and map for increased usability. The statistical distribution of latencies for the past 24 hours also is shown.

More information about CDDIS real-time data

Side by side images with global maps in the upper half of each image and data plots on the lower half
Image Caption

Left image: Map and table of NTRIP Caster stream availability and current latency of the data. Right image: Map and plot showing distribution of latencies for a particular stream over the past 24 hours. Click on image for larger view. Credit: NASA's CDDIS.

Global Hydrometeorology Resource Center Distributed Active Archive Center (GHRC DAAC)

This map, which shows a large portion of the Pacific Ocean and North and South America, shows the density of lightning in the atmosphere.  Red areas indicate high lightning density, blue areas represent low lightning density. The data from the Geostationary Lighting Mapper instruments on the GOES East and West satellites.
Image Caption

Map of lighting flash density over North and South America based on GLM data acquired by the NOAA GOES East and GOES West satellites. Red areas indicate greater lightning density; blue areas indicate lesser density. Credit: NOAA.

Geostationary Lightning Mapper (GLM) Level 3 Gridded Products Dataset Published

The GLM Level 3 data will serve as an excellent companion dataset to existing lightning data distributed by NASA's GHRC DAAC, particularly the International Space Station Lightning Imaging Sensor. The GHRC DAAC data team notes that this publication represents the first end-to-end cloud publication of an ongoing dataset. This means that the entire process—from data ingest to metadata extraction to publication—used GHRC’s cloud-based workflow exclusively. Further, as an ongoing dataset, new GLM data that arrive each day will continue to use this cloud-based workflow.

GLM data access and more information

Goddard Earth Sciences Data and Information Services Center (GES DISC)

Orbiting Carbon Observatory-2 Releases Level 2 Lite File Version 11.1r

The Orbiting Carbon Observatory-2 (OCO-2) mission team released a new version of the Level 2 Lite data product, version 11.1r. The data have been released in formats similar to past Level 2 Lite datasets. In addition, an update to the OCO-2/OCO-3 Data User’s Guide has been released, which contains more information on the version 11.1r data products.

OCO-2 Level 2 Lite File Version 11.1r data access and more information

OMI Collection 4 Ancillary Support Products Released

The Ozone Monitoring Instrument (OMI) team released Collection 4 ancillary support products. There are two types of ancillary products. The first contains co-located meteorological fields from the Goddard Modeling and Assimilation Office (GMAO) Forward Processing for Instrument Teams (FP-IT). The second is a new ancillary product that includes additional algorithm support products, such as co-located snow/ice information, terrain height, land type classification, saturation flags, and UV-based row anomaly flags.

OMI Collection 4 data product access and more information

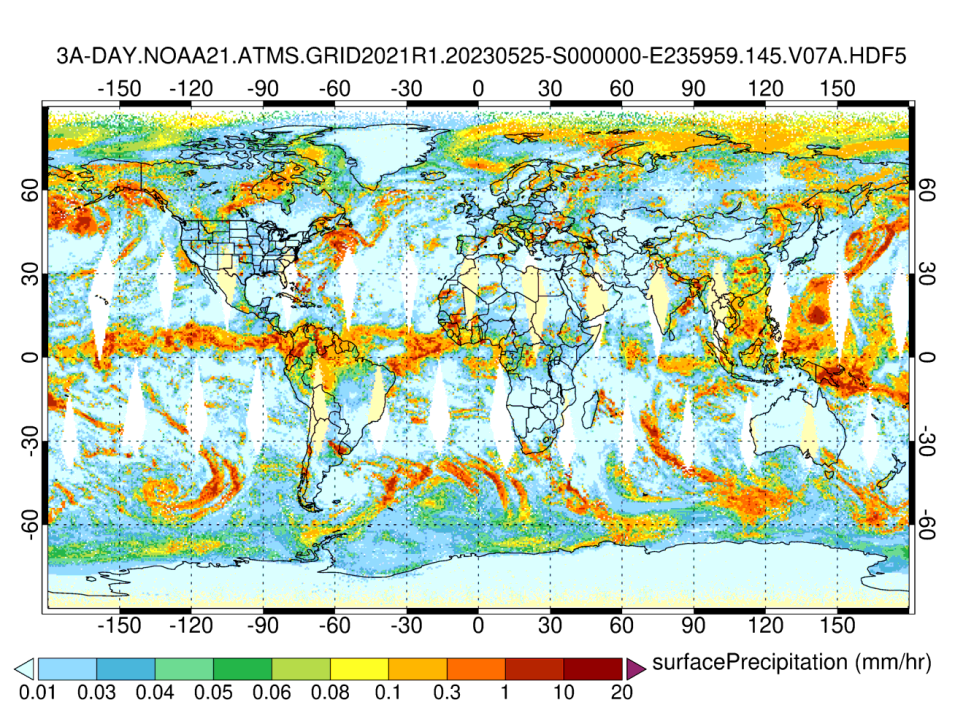
This map of the world shows data on precipitation in millimeters per hour from the Advances Technology Microwave Sounder instrument aboard the NOAA-21 satellite. Brighter colors (red and yellows) correspond to higher amounts of precipitation.
Image Caption

This global map of daily ATMS surface precipitation data shows precipitation in millimeters per hour on May 25, 2023. Brighter colors indicate higher levels of precipitation. Credit: NASA's GES DISC.

New Data from NOAA-21’s Advanced Technology Microwave Sounder Released

The Global Precipitation Measurement (GPM) Project, the Precipitation Processing System, and NASA's GES DISC released new datasets from the Advanced Technology Microwave Sounder (ATMS) aboard the NOAA-21 satellite. The data begin in February 2023 and include Level 1 common calibrated brightness temperatures and Level 2 and Level 3 gridded Goddard Profiling Algorithm precipitation retrievals.

GPM partner microwave radiometer ATMS on NOAA-21 (JPSS-2)

Level 3 RAMSES-II Data Released

The Retrieval Algorithm for Microwave Sounders in Earth Science (RAMSES-II) project, along with the Sounder Science Investigator-led Processing System (SIPS) at NASA's Jet Propulsion Laboratory (JPL), and NASA’s GES DISC have released Level 3 RAMSES-II data. The Level 3 retrieval products contain a variety of geophysical parameters including profiles of temperature, water in all phases, and surface properties retrieved from the ATMS instrument aboard the joint NASA/NOAA Suomi National Polar-orbiting Partnership (Suomi NPP) and NOAA-20 satellites.

RAMSES-II level 3, version 3 data access and more information

Land Processes Distributed Active Archive Center (LP DAAC)

EMIT Level 2B Estimated Mineral Identification and Band Depth and Uncertainty Product Released

NASA's LP DAAC released a Level 2B Estimated Mineral Identification and Band Depth and Uncertainty data product from NASA’s Earth Surface Mineral Dust Source Investigation (EMIT). The product provides estimated mineral identification, band depths, and uncertainty data in a spatially raw, non-orthocorrected format at a 60-meter spatial resolution. EMIT is an imaging spectrometer that records visible to short-wave infrared light reflected from the surface of Earth’s arid dust source regions. EMIT data will help researchers better understand the compositional makeup of dust particles on the ground and the role they play in heating and cooling Earth’s atmosphere and surface when they become airborne.

EMIT Level 2B Estimated Mineral Identification and Band Depth and Uncertainty (EMITL2BMIN) data product

Level 1 and Atmosphere Archive and Distribution System Distributed Active Archive Center (LAADS DAAC)

CEOS in green with Earth for the letter O; acronym spelled out below in gray.
Image Caption

CEOS Endorsement of the Nighttime Light Surface Radiance Product Family Specification v1.0

NASA’s LAADS DAAC has added additional information to the Suomi National Polar-orbiting Partnership (Suomi NPP) Visible Infrared Imaging Radiometer Suite (VIIRS) Level-1 Calibrated Radiances and Geolocation and the Level-3 Nighttime Lights products' landing pages. This update was made to support the Committee on Earth Observation Satellites (CEOS)-endorsed version 1.0 Product Family Specification (PFS) for Nighttime Light Surface Radiance.

Updated Dataset Landing Pages: Nighttime Light Surface Radiance Products

National Snow and Ice Data Center Distributed Active Archive Center (NSIDC DAAC)

NSIDC Releases New Datasets for High Mountain Asia, Greenland, and Other Locations

The logo for the National Snow and Ice Data Center, which features a blue orb (representing Earth), with faded latitude and longitude lines, the letters NSIDC, and snowflake.
Image Caption

The High Mountain Asia Landslide Catalog, Version 2 dataset is now available. The catalog is an inventory of approximately 2,800 landslides that occurred in the High Mountain Asia study area between January 5, 2007, and December 31, 2018, as well as one event from January 28, 1990. The catalog lists the dates and locations of the landslides along with additional characteristics, such as event triggers, country, landslide length and area, and the number of injuries and fatalities.

Access the Landslide Catalog and more information

The MEaSUREs Greenland Image Mosaics from Sentinel-1A and -1B Version 4 dataset has been updated. This dataset is part of NASA's Making Earth System Data Records for Use in Research Environments (MEaSUREs) program, and its temporal coverage now spans from January 1, 2015, to March 25, 2023. It consists of 6-day and 12-day, 50-meter resolution image mosaics of the Greenland coastline and ice sheet periphery. The mosaics are derived from C-band Synthetic Aperture Radar (SAR) data acquired by the ESA (European Space Agency) Copernicus Sentinel-1A and -1B satellites.

Access Greenland Image Mosaics and more information

The Massachusetts Lidar Derived Digital Elevation Model, Version 1 and Millbrook Lidar Derived Digital Elevation Model, Version 1 datasets from NASA's Soil Moisture Active Passive (SMAP) Validation Experiment 2019 to 2022 (SMAPVEX19-22) campaign are now available. These digital elevation model data consist of ground surface elevations derived from lidar measurements collected in April and August 2022 in the vicinity of Millbrook, New York, and Petersham, Massachusetts, during the SMAPVEX19-22 campaign. These locations were chosen due to their forested land cover, as the aim of SMAPVEX19-22 was to improve soil moisture and vegetation opacity retrieval in forests and to provide additional reference for SMAP/Sentinel-1 product validation.

SMAPVEX19-22 data access and more information

The SnowEx20 Grand Mesa Intensive Operation Period Computed Tomography Snow Microstructure, Version 1 dataset is now available. This dataset characterizes snow microstructure of six snow pits from the SnowEx 2020 Grand Mesa, Colorado, Intensive Observation Period using microcomputed tomography. These data were collected from February 3, 2020, to February 8, 2020.

SnowEx20 data access and more information

The Ice, Cloud and land Elevation Satellite-2 (ICESat-2) Calibration/Validation Land, Vegetation, and Ice Sensor (LVIS) Level 1B Georeferenced Imagery, Version 1 dataset is now available. This dataset contains georeferenced imagery from the LVIS PhaseOne medium-format camera, which operated on high-altitude segments of flights during the ICESat-2 2022 Arctic Summer calibration campaign. Images were captured over the Arctic Ocean, Northern Canadian Archipelago, and Northern Greenland from July 11 to July 26, 2022.

LVIS L1B Georeferenced Imagery. Version 1 data access and more information

The Land Cover Classification, Snow Cover, and Fractional Snow-Covered Area Maps from Maxar WorldView Satellite Images, Version 1 dataset is now available. This dataset includes fine-scale snow and land cover maps from two mountainous study sites in the Western United States, binary snow maps derived from the land cover maps, and 30-meter and 465-meter fractional snow-covered area (fSCA) maps. Also included are Landsat and Moderate Resolution Imaging Spectroradiometer (MODIS) fSCA map products. Temporal coverage spans from May 20, 2015, to May 5, 2019.

Maxar WorldView satellite images data access and more information

Oak Ridge National Laboratory Distributed Active Archive Center (ORNL DAAC)
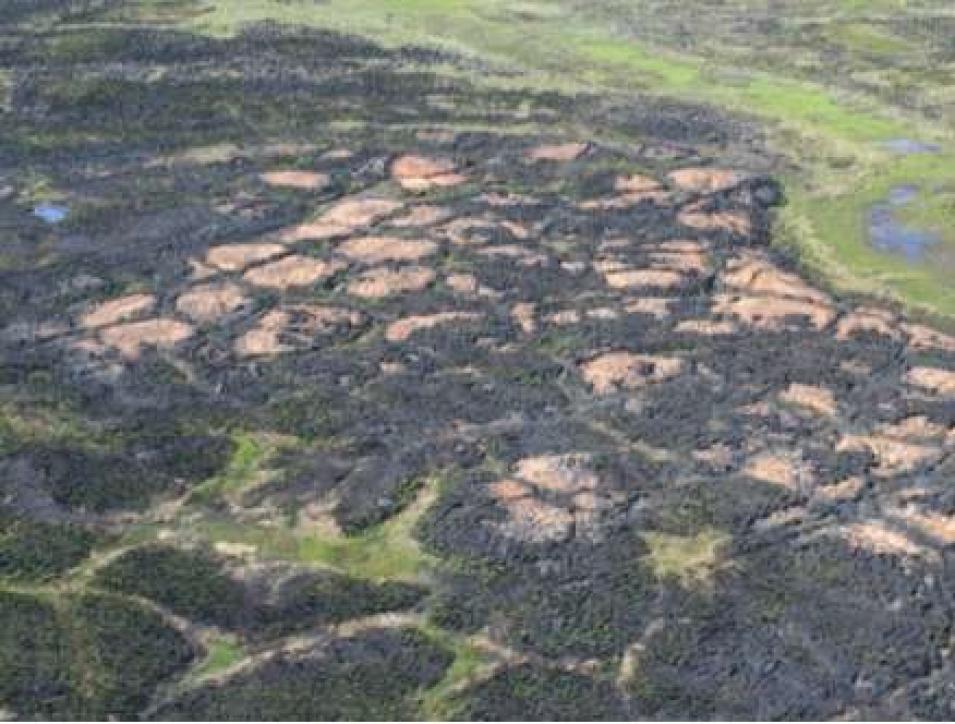
This image from 2008 provides an aerial view of burned and unburned areas in the region of the Anaktuvuk River tundra fire on the Arctic Slope of Alaska. The post-fire landscape is a mosaic or green, brown, and tan areas that correspond to the vegetation, or lack thereof, on the landscape.
Image Caption

An 2008 aerial view of the landscape after the 2007 Anaktuvuk River fire. Credit:
D. Yokel.

ABoVE: Post-Fire and Unburned Field Site Data, Anaktuvuk River Fire Area, 2008-2017 Dataset Now Available

NASA's ORNL DAAC released a new Arctic-Boreal Vulnerability Experiment (ABoVE) dataset: Post-Fire and Unburned Field Site Data, Anaktuvuk River Fire Area, 2008-2017. This dataset includes field measurements from 26 burned and unburned transects established in 2008 in the region of the Anaktuvuk River tundra fire on the Arctic Slope of Alaska. Measurements include plant cover by species, shrub and tussock density, thaw depth, and soil depth. This wildfire occurred in 2007, and sampling took place from 2008 to 2011 and again in 2017.

ABoVE, a NASA Terrestrial Ecology Program, is an 8- to 10-year field campaign in Alaska and Western Canada that began in 2015. Its goal is to provide a foundation for improving the analysis and modeling capabilities needed to understand and predict ecosystem responses to and societal implications of climate change in the Arctic and Boreal regions.

Access ABoVE Post-Fire and Unburned Field Site data and more information

Delta-X Mission Datasets on Bed and Suspended Sediment Grain Size and Water Surface Elevations Released

Three new Delta-X datasets are available at ORNL DAAC. NASA's Delta-X mission is a 5-year Earth Ventures Suborbital-3 mission to study the Mississippi River Delta, which is growing and sinking in different areas.

The Delta-X: Bed and Suspended Sediment Grain Size, Mississippi River Delta, Louisiana, United States, 2021, Version 2 dataset provides sediment concentration and grain size distribution measurements from suspended and bed sediment samples collected in the Atchafalaya and Terrebonne River Basins. The measurements were collected as part of the Delta-X Spring campaign between March 24 to April 2, 2021, and the Delta-X Fall campaign between August 17 and 25, 2021.

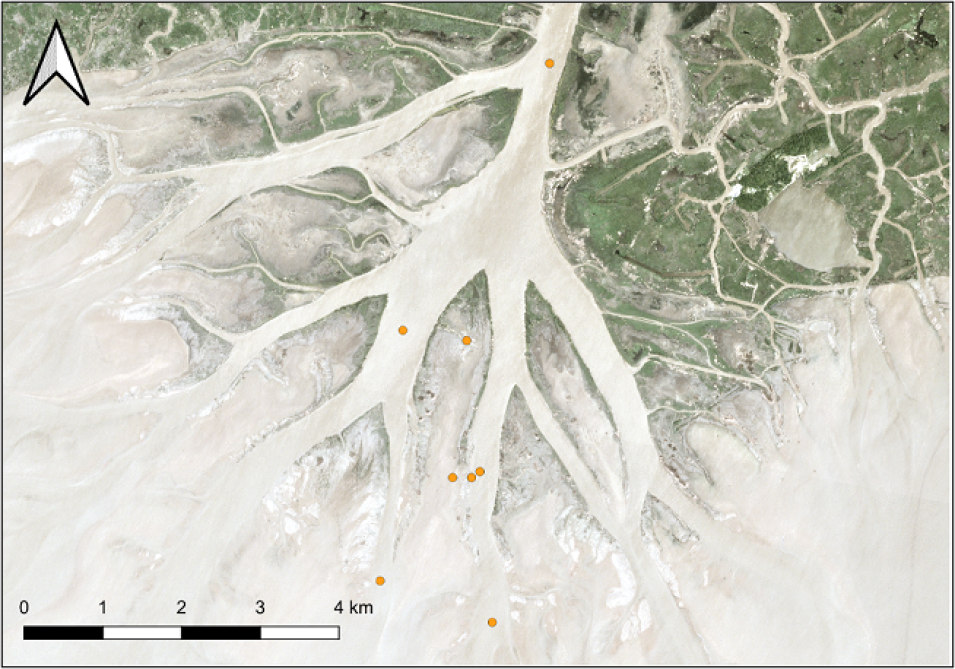
An aerial image of the Wax Lake Delta in Louisiana from the Delta-X project showing white, vein-like branches of the Mississippi River cutting through light-green areas of river delta before reaching the waters of the Gulf of Mexico.
Image Caption

An aerial image of the Wax Lake Delta in Louisiana from the Delta-X mission showing suspended and bed sediment sampling locations. Credit: NASA's ORNL DAAC.

Access Delta-X Suspended Sediment Grain Size data and more information

The Delta-X: AirSWOT Level 2 (L2) Geocoded Water Surface Elevation, Mississippi River Delta, Louisiana, 2021, Version 2 dataset contains Level 2 AirSWOT geocoded products, including estimated water surface elevation. Data were collected during the Delta-X airborne campaign over the Atchafalaya and Terrebonne basins of the Mississippi River Delta in Louisiana. Flights occurred from March 26 to April 18, 2021, and from August 21 to September 12, 2021.

The AirSWOT instrument is capable of producing high resolution (3.6-meter) digital elevation models over land and water bodies using near-nadir wide-swath Ka-band radar interferometry to measure water-surface elevation and produce continuous gridded elevation data. AirSWOT elevation data are useful for calibrating elevation and slopes along main channels as well as tying observations to open ocean tidal conditions, and is an airborne calibration and validation instrument for the Surface Water and Ocean Topography (SWOT) satellite.

Access AirSWOT Level 2 Geocoded Water Surface Elevation data and more information

The Delta-X: AirSWOT Level 3 (L3) Water Surface Elevations, Mississippi River Delta, Louisiana 2021 dataset contains water surface elevations at selected point locations generated from AirSWOT data collected during the Spring and Fall 2021 over the Atchafalaya and Terrebonne basins in Louisiana. The Level 3 data were created by masking land areas out of the AirSWOT Level 2 products and then filtering and averaging to the AirSWOT heights to produce water surface elevations at selected points throughout the scene.

Access AirSWOT Level 3 Water Surface Elevations data and more information

Physical Oceanography Distributed Active Archive Center (PO.DAAC)

JPL SMAP Level 2B Near Real-time CAP Sea Surface Salinity V5.0 Validated Dataset Now Available

The dataset offers validated sea surface salinity (SSS) and extreme winds orbital/swath product from NASA's Soil Moisture Active Passive (SMAP) satellite. The product, which has latency of approximately 2 hours, is based on the Combined Active-Passive (CAP) retrieval algorithm originally developed for Aquarius/SAC-D. The dataset is accessible in the NASA Earthdata Cloud via the PO.DAAC data portal. For detailed information about cloud data access, visit the PO.DAAC Cloud Data web page.

Access SMAP CAP Sea Surface Salinity V5.0 data and more information

Details

Last Updated

Published

Data Center/Project

Atmospheric Science Data Center (ASDC)
Alaska Satellite Facility DAAC (ASF DAAC)
Crustal Dynamics Data Information System (CDDIS)
Goddard Earth Sciences Data and Information Services Center (GES DISC)
Global Hydrometeorology Resource Center DAAC (GHRC DAAC)
Level 1 and Atmosphere Archive and Distribution System DAAC (LAADS DAAC)
Land Processes DAAC (LP DAAC)
National Snow and Ice Data Center DAAC (NSIDC DAAC)
Oak Ridge National Laboratory DAAC (ORNL DAAC)
Physical Oceanography DAAC (PO.DAAC)