Drought, vegetation health, and soil moisture all can be tracked remotely. This Data Pathfinder provides links to NASA Earth observations, tools, and other resources applicable to agricultural production and water management.
The planet NASA studies the most is Earth. NASA’s end-to-end Earth observations enable agricultural producers to make informed decisions about global market conditions, water management, in-season crop conditions, severe weather, and sustainability.
Find the Data
This Data Pathfinder will help guide you through the process of selecting and using datasets applicable to agriculture and water management, and provides links to specific data sources. If you are new to remote sensing, the What is Remote Sensing? Backgrounder provides a comprehensive overview. In addition, NASA's Applied Remote Sensing Training Program (ARSET) provides numerous training modules, including Fundamentals of Remote Sensing.
If you have specific questions about how to use data, tools, or resources mentioned in this Data Pathfinder, please visit the Earthdata Forum. Here, you can interact with other data users and NASA subject matter experts on a variety of Earth science research and applications topics.
Tools for Using the Data
This section provides links to NASA and external tools and applications relevant to analyzing and visualizing agriculture and water management data referenced in this Data Pathfinder. NASA's Earth Science Data Systems (ESDS) Program maintains many more resources for data analysis that may be helpful. Explore the full list on the NASA Earthdata Data Tools page.
The Agrometeorological (AGMET) Earth Observations (EO) Indicators bring together a variety of EO data products on the sub-national scale, each of which provides valuable insights on in-season crop development and current crop conditions. Each AGMET Indicator consists of several EO data plots that quantify critical indicators related to crop health for a specific region and crop over time and are updated every 7-12 days. Combined, the different EO data plots help tell the story of in-season crop conditions through the use of different climate, environmental, and vegetative variables.
AppEEARS: Application for Extracting and Exploring Analysis Ready Samples
The Application for Extracting and Exploring Analysis Ready Samples (AppEEARS) offers a simple and efficient way to access and transform geospatial data from a variety of federal data archives. AppEEARS enables users to subset geospatial datasets using spatial, temporal, and band/layer parameters. Two types of sample requests are available: point samples for geographic coordinates and area samples for spatial areas via vector polygons. Sample requests submitted to AppEEARS provide users not only with data values, but also associated quality data values. Interactive visualizations with summary statistics are provided for each sample within the application, which allow users to preview and interact with their samples before downloading their data. Visit the AppEEARS Getting Started to learn more about workflows, viewing results, interacting with results, and downloading requests.
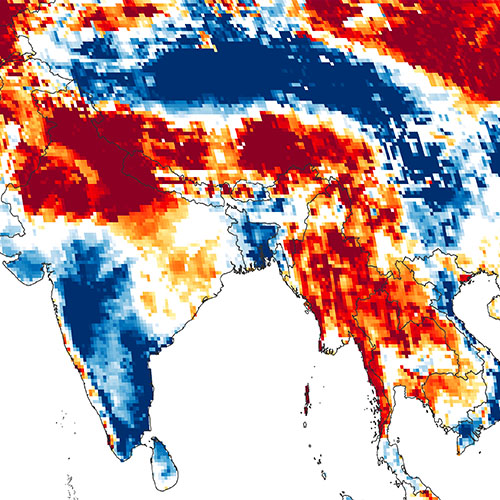
ClimateSERV
The ClimateSERV data visualization tool enables users to visualize and download historical rainfall data, vegetation condition data, and 180-day forecasts of rainfall and temperature to improve understanding of, and make improved decisions for, issues related to agriculture and water availability. ClimateSERV offers an API for those who wish to incorporate their data into a separate application or script.
Image
Crop Condition and Soil Moisture Analytics (Crop-CASMA)
Crop Condition and Soil Moisture Analytics (Crop-CASMA) provides access to high-resolution data from NASA’s Soil Moisture Active Passive (SMAP) mission and the Moderate Resolution Imaging Spectroradiometer (MODIS) instrument in an easy-to-use format. Soil moisture data are critical for professionals in the agriculture and natural resources sectors who use soil moisture in tandem with other data to plan crop planting, forecast yields, track droughts or floods, and improve weather forecasts. This application offers a suite of services such as Web Map Service (WMS), Web Coverage Service (WCS), and Web Processing Services (WPS).
Earthdata Search is NASA's tool for searching for and discovering NASA Earth science data as well as relevant data available through U.S. and international agencies. Users can search for and read about data collections, search for data files by date and spatial area, preview browse images, and download or submit requests for data files, with customization for select data collections. Note: An Earthdata Login is required to download data.
Image
In the project area (for some datasets) users can customize granules. Users can reformat the data and output as HDF, NetCDF, ASCII, KML, or a GeoTIFF and can choose from a variety of projection options. Data can be subset to obtain only the bands that are needed.
Image
Famine Early Warning Systems Network (FEWS NET)
The Famine Early Warning Systems Network (FEWS NET) provides early warning and analysis on food insecurity. Created by the U.S. Agency for International Development (USAID) to help decision-makers plan for humanitarian crises, FEWS NET provides evidence-based analysis on more than 30 countries. The FEWS Net Land Data Assimilation System (FLDAS) is a custom instance of NASA's Land Information System (LIS) that has been adapted to work with domains, data streams, and monitoring and forecast requirements associated with food security assessment in data-sparse, developing-countries. The integration of LIS allows FEWS NET to leverage existing land surface models and generate ensembles of soil moisture, evapotranspiration (ET), and other variables based on multiple meteorological inputs or land surface models.
The USGS FEWS NET Data Portal provides access to geo-spatial data, satellite image products, and derived data products in support of FEWS NET drought monitoring efforts throughout the world. This portal is provided by the USGS FEWS NET Project, part of the Early Warning Focus Area at the USGS Earth Resources Observation and Science (EROS) Center.
Image
Giovanni
NASA’s Giovanni is an online application for the display and analysis of geophysical parameters. There are many options for analysis. For more information on choosing a type of plot, see the Giovanni User Manual. Note: An Earthdata Login is required for full Giovanni functionality.
Image
Single parameter analysis options include:
Lat–Lon map of time-averaged data
Map of a shaped region, such as country, watershed
Time-series of bounding box area-averaged data
Time-series of a shaped area-averaged data (country or watershed)
Hovmöllerdiagram/cross section map
Histogram
Vertical profile, cross-section map
Zonal mean
Animations of Lat–Lon map over time
Multi-year monthly averaged
Interannual Monthly or seasonal mean
Calculate accumulation (such as precipitation)
Multi-parameter analysis options include:
Scatter plots with regression statistics
Temporal correlation maps
Lat–Lon map overlain with 2nd parameter contour plot
Data recipe for downloading a Giovanni map as NetCDF and converting its data to quantifiable map data in the form of latitude-longitude-data value ASCII text
Provides WMS and WCS to other web servers to get maps or data from Giovanni
Global Agriculture Monitoring System (GLAM)
GLAM is a web-based platform that enables near-real-time monitoring of global croplands, primarily using NASA MODIS satellite data. This tool is being redesigned to incorporate new datasets and improve its speed, flexibility, and computing power.
The U.S. Drought Monitor is a weekly map of drought conditions used by policymakers to help determine drought relief allocations and declarations of drought. NASA satellites provide data about water availability to the U.S. Drought Monitor.
Image
USGS GFSAD Cropland Data
This USGS GFSAD Cropland Data visualization tool by the USGS provides the Global Food Security Analysis-Support Data at 30 Meters (GFSAD30), visualizing nearly 1.874 billion hectares (roughly 12.6% of the global terrestrial area) of global croplands.
Image
Worldview
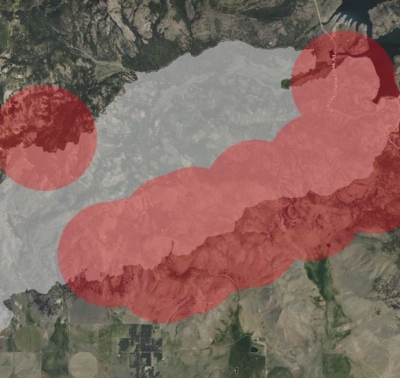
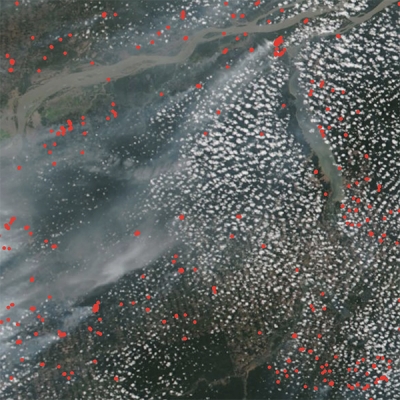
The NASA Worldview data visualization application provides the capability to interactively browse more than 1,000 global, full-resolution satellite imagery layers and download the underlying data. Many of the available imagery layers are updated within three hours of observation, which supports time-critical application areas such as wildfire management, air quality measurements, and flood monitoring. Worldview imagery is provided through NASA's Global Imagery Browse Services (GIBS). Worldview also includes geostationary imagery layers from the GOES-East, GOES-West, and Himawari-8 geostationary satellites that are available at 10-minute increments for the last 30 days.
Image
Prepare
AppEEARS: Application for Extracting and Exploring Analysis Ready Samples
The Application for Extracting and Exploring Analysis Ready Samples (AppEEARS) offers a simple and efficient way to access and transform geospatial data from a variety of federal data archives. AppEEARS enables users to subset geospatial datasets using spatial, temporal, and band/layer parameters. Two types of sample requests are available: point samples for geographic coordinates and area samples for spatial areas via vector polygons. Sample requests submitted to AρρEEARS provide users not only with data values, but also associated quality data values. Interactive visualizations with summary statistics are provided for each sample within the application, which allow users to preview and interact with their samples before downloading their data. Visit the AppEEARS Getting Started to learn more about workflows, viewing results, interacting with results and downloading requests.
Earthdata Search
Earthdata Search is NASA's tool for searching for and discovering NASA Earth science data as well as relevant data available through U.S. and international agencies. Users can search for and read about data collections, search for data files by date and spatial area, preview browse images, and download or submit requests for data files, with customization for select data collections. Note: An Earthdata Login is required to download data.
Image
In the project area (for some datasets) users can customize granules. Users can reformat the data and output as HDF, NetCDF, ASCII, KML, or a GeoTIFF and can choose from a variety of projection options. Data can be subset to obtain only the bands that are needed.
Image
Giovanni
NASA’s Giovanni is an online application for the display and analysis of geophysical parameters. There are many options for analysis. For more information on choosing a type of plot, see the Giovanni User Manual. Note: An Earthdata Login is required for full Giovanni functionality.
Image
Single parameter analysis options include:
Lat–Lon map of time-averaged data
Map of a shaped region, such as country, watershed
Time-series of bounding box area-averaged data
Time-series of a shaped area-averaged data (country or watershed)
Hovmöllerdiagram/cross section map
Histogram
Vertical profile, cross-section map
Zonal mean
Animations of Lat–Lon map over time
Multi-year monthly averaged
Interannual Monthly or seasonal mean
Calculate accumulation (such as precipitation)
Multi-parameter analysis options include:
Scatter plots with regression statistics
Temporal correlation maps
Lat–Lon map overlain with 2nd parameter contour plot
Data recipe for downloading a Giovanni map as NetCDF and converting its data to quantifiable map data in the form of latitude-longitude-data value ASCII text
With the Global Subset Tool, users can request a subset for any location on Earth as a GeoTiff and in text format, including interactive time-series plots and more. Users specify a site by entering the site's geographic coordinates and the area surrounding that site, from one pixel up to 201 x 201 km. From the available datasets, users can specify a date and then select from MODIS Sinusoidal Projection or Geographic Lat/Long. Note: An Earthdata Login is required to request data
With the Fixed Sites Subsets Tool, users can download pre-processed subsets for more than 3,000 field and flux tower sites for validation of models and remote sensing products. The goal of the Fixed Sites Subsets Tool is to prepare summaries of selected data products for the community to characterize field sites. It includes sites from networks such as National Ecological Observatory Network, Forest Global Earth Observatory network, Phenology Camera network, and Long Term Ecological Research Network
With the Web Service, users can retrieve subset data (in real-time) for any location, time period, and area programmatically using a REST web service. Web service client and libraries are available in multiple programming languages, allowing integration of subsets into a workflow
Panoply
NetCDF, HDF, GRIB, and other datasets can be viewed using NASA’s Panoply data viewer. Panoply is a cross-platform application that plots geo-referenced and other arrays, and offers additional functionality such as slicing and plotting arrays, combining arrays, and exporting plots and animations. Panoply is a cross-platform application that runs on Macintosh, Windows, Linux and other desktop computers. Panoply requires that your computer has have had a compatible Java 11 (or later version) JRE or JDK installed.
Image
With Panoply 5 you can:
Create color contour plots of geo-referenced latitude-longitude, latitude-vertical, longitude-vertical, time-latitude or time-vertical arrays sliced from 2D or larger multidimensional variables
Create color contour plots of "generic" 2D arrays from 2D or larger multidimensional variables
Create line plots of data from 1D or larger multidimensional variables
Combine two geo-referenced arrays in one plot by differencing, summing or averaging
Create map plots of trajectory data based on the CF convention or similar
Plot lon-lat data on a global or regional map using any of over 200 map projections or make a zonal average line plot
Overlay continent outlines or masks on lon-lat map plots
Use any of numerous color tables for the scale colorbar, or apply your own custom ACT, CPT, or RGB color table
Save plots to disk GIF, JPEG, PNG, or TIFF bitmap images or as PDF or PostScript graphics files
Export lon-lat map plots in KMZ format
Open remote netCDF and HDF dataset stored on an HTTP/HTTPS website or in an S3 bucket
Explore remote THREDDS and OPeNDAP catalogs and open datasets served from them
Export animations as MP4 video or as a collection of individual frame images
NASA's Prediction Of Worldwide Energy Resources (POWER) offers geospatially-enabled meteorology and solar-related parameters formulated for the agroclimatology community. It provides various widgets for mapping, analysis, and data download tools, as well as API services to access the POWER data holdings through custom scripts and scalable applications. The POWER Data Services consists of a series of restful Application Programming Interfaces (APIs), geospatial enabled image services, and Open-source Project for a Network Data Access Protocol (OPeNDAP) services. These three service offerings support data discovery, access, and distribution as Analysis Ready Data and as direct application inputs to decision-to-support tools.
The Agrometeorological (AGMET) Earth Observations (EO) Indicators bring together a variety of EO data products on the sub-national scale, each of which provides valuable insights on in-season crop development and current crop conditions. Each AGMET Indicator consists of several EO data plots that quantify critical indicators related to crop health for a specific region and crop over time and are updated every 7-12 days. Combined, the different EO data plots help tell the story of in-season crop conditions through the use of different climate, environmental, and vegetative variables.
A Guide to NASA's GIS Agriculture Resources and Data
Discover the NASA Earth Science resources that give insight to agricultural applications. The data found in this web map can be applied to the following areas:
Water Availability: Plant Stress, Soil Moisture, Drought, Irrigation Weather, Extreme Events and Better Seasonal and Sub-Seasonal Projections: NASA Models Informing NOAA, USDA and Drought Monitor Operational Forecasting
For GIS users: see how to use NASA data and services in common GIS tools in the GIS Pathfinder and check out the How To guides to get help with your workflows.
Image
Data layers showing rainfall, evaporative stress, and more in the Agriculture GIS Web Map. Credit: NASA
ClimateSERV
The ClimateSERV data visualization tool enables users to visualize and download historical rainfall data, vegetation condition data, and 180-day forecasts of rainfall and temperature to improve understanding of, and make improved decisions for, issues related to agriculture and water availability. ClimateSERV offers an API for those who wish to incorporate their data into a separate application or script.
Image
Crop Condition and Soil Moisture Analytics (Crop-CASMA)
Crop Condition and Soil Moisture Analytics (Crop-CASMA) provides access to high-resolution data from NASA’s Soil Moisture Active Passive (SMAP) mission and the Moderate Resolution Imaging Spectroradiometer (MODIS) instrument in an easy-to-use format. Soil moisture data are critical for professionals in the agriculture and natural resources sectors who use soil moisture in tandem with other data to plan crop planting, forecast yields, track droughts or floods, and improve weather forecasts. This application offers a suite of services such as Web Map Service (WMS), Web Coverage Service (WCS), and Web Processing Services (WPS).
The Crop Monitor Exploring Tool is an an online interactive resource that provides NDVI, temperature, precipitation, soil moisture, ET, and runoff data to determine crop conditions for a variety of different crops in Early Warning countries (Africa and Asia) and Agricultural Market Information System (AMIS) countries (North America, Europe, and Asia) by the Group on Earth Observations Global Agricultural Monitoring (GEOGLAM).
Image
Famine Early Warning Systems Network (FEWS NET)
The Famine Early Warning Systems Network (FEWS NET) provides early warning and analysis on food insecurity. Created by the U.S. Agency for International Development (USAID) to help decision-makers plan for humanitarian crises, FEWS NET provides evidence-based analysis on more than 30 countries. The FEWS Net Land Data Assimilation System (FLDAS) is a custom instance of NASA's Land Information System (LIS) that has been adapted to work with domains, data streams, and monitoring and forecast requirements associated with food security assessment in data-sparse, developing-countries. The integration of LIS allows FEWS NET to leverage existing land surface models and generate ensembles of soil moisture, evapotranspiration (ET), and other variables based on multiple meteorological inputs or land surface models.
The USGS FEWS NET Data Portal provides access to geo-spatial data, satellite image products, and derived data products in support of FEWS NET drought monitoring efforts throughout the world. This portal is provided by the USGS FEWS NET Project, part of the Early Warning Focus Area at the USGS Earth Resources Observation and Science (EROS) Center.
Image
Giovanni
NASA’s Giovanni is an online application for the display and analysis of geophysical parameters. There are many options for analysis. For more information on choosing a type of plot, see the Giovanni User Manual. Note: An Earthdata Login is required for full Giovanni functionality.
Image
Single parameter analysis options include:
Lat–Lon map of time-averaged data
Map of a shaped region, such as country, watershed
Time-series of bounding box area-averaged data
Time-series of a shaped area-averaged data (country or watershed)
Hovmöllerdiagram/cross section map
Histogram
Vertical profile, cross-section map
Zonal mean
Animations of Lat–Lon map over time
Multi-year monthly averaged
Interannual Monthly or seasonal mean
Calculate accumulation (such as precipitation)
Multi-parameter analysis options include:
Scatter plots with regression statistics
Temporal correlation maps
Lat–Lon map overlain with 2nd parameter contour plot
Data recipe for downloading a Giovanni map as NetCDF and converting its data to quantifiable map data in the form of latitude-longitude-data value ASCII text
Provides WMS and WCS to other web servers to get maps or data from Giovanni
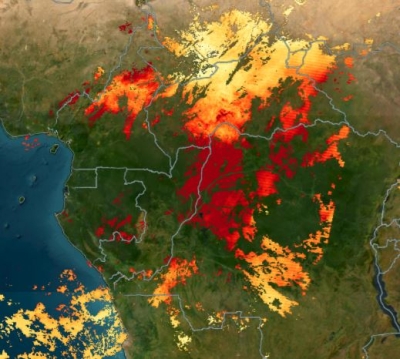
Global Agriculture Monitoring System (GLAM)
GLAM is a web-based platform that enables near-real-time monitoring of global croplands, primarily using NASA MODIS satellite data. This tool is being redesigned to incorporate new datasets and improve its speed, flexibility, and computing power.
NetCDF, HDF, GRIB, and other datasets can be viewed using NASA’s Panoply data viewer. Panoply is a cross-platform application that plots geo-referenced and other arrays, and offers additional functionality such as slicing and plotting arrays, combining arrays, and exporting plots and animations. Panoply is a cross-platform application that runs on Macintosh, Windows, Linux and other desktop computers. Panoply requires that your computer has have had a compatible Java 11 (or later version) JRE or JDK installed.
Image
With Panoply 5 you can:
Create color contour plots of geo-referenced latitude-longitude, latitude-vertical, longitude-vertical, time-latitude or time-vertical arrays sliced from 2D or larger multidimensional variables
Create color contour plots of "generic" 2D arrays from 2D or larger multidimensional variables
Create line plots of data from 1D or larger multidimensional variables
Combine two geo-referenced arrays in one plot by differencing, summing or averaging
Create map plots of trajectory data based on the CF convention or similar
Plot lon-lat data on a global or regional map using any of over 200 map projections or make a zonal average line plot
Overlay continent outlines or masks on lon-lat map plots
Use any of numerous color tables for the scale colorbar, or apply your own custom ACT, CPT, or RGB color table
Save plots to disk GIF, JPEG, PNG, or TIFF bitmap images or as PDF or PostScript graphics files
Export lon-lat map plots in KMZ format
Open remote netCDF and HDF dataset stored on an HTTP/HTTPS website or in an S3 bucket
Explore remote THREDDS and OPeNDAP catalogs and open datasets served from them
Export animations as MP4 video or as a collection of individual frame images
NASA's Prediction Of Worldwide Energy Resources (POWER) offers geospatially-enabled meteorology and solar-related parameters formulated for the agroclimatology community. It provides various widgets for mapping, analysis, and data download tools, as well as API services to access the POWER data holdings through custom scripts and scalable applications. The POWER Data Services consists of a series of restful Application Programming Interfaces (APIs), geospatial enabled image services, and Open-source Project for a Network Data Access Protocol (OPeNDAP) services. These three service offerings support data discovery, access, and distribution as Analysis Ready Data and as direct application inputs to decision-to-support tools.
NASA's Oak Ridge National Laboratory DAAC (ORNL DAAC) developed a Soil Moisture Visualizer tool (read about it at Soil Moisture Data Sets Become Fertile Ground for Applications) that integrates a variety of North American soil moisture datasets. The visualization tool incorporates in-situ, airborne, and remote sensing data into one easy-to-use platform. This integration helps to validate and calibrate the data and provides spatial and temporal data continuity. It also facilitates exploratory analysis and data discovery for different groups of users. The Soil Moisture Visualizer offers the capability to geographically subset and download time series data in .csv format. For more information on the available datasets and use of the visualizer, view the Soil Moisture Visualizer Guide.
To use the visualizer, select a dataset of interest under Data. Depending on the dataset chosen, the visualizer provides the included latitude/longitude or an actual site location name and relative time frames of data collection. Upon selecting a parameter, the tool displays a time series with available datasets. All measurements are volumetric soil moisture. Surface soil moisture is the daily average of measurements at 0-5 cm depth and root zone soil moisture (RZSM) is the daily average of measurements at 0-100 cm depth. The visualizer also provides data sources for download.
Image
The Soil Moisture Visualizer allows users to compare soil moisture measurements from multiple sources at the same location. In this screenshot, Level 4 Root Zone Soil Moisture (L4 RZSM) data acquired by NASA’s Soil Moisture Active Passive (SMAP) satellite are shown with data from in situ sensors across the 9-kilometer Equal-Area Scalable Earth (EASE) grid cell encompassing the Tonzi Ranch Fluxnet site in the Sierra Nevada foothills of California, USA. Daily precipitation values for the site (purple spikes) are also provided for reference. Credit: NASA ORNL DAAC.
Worldview
The NASA Worldview data visualization application provides the capability to interactively browse more than 1,000 global, full-resolution satellite imagery layers and download the underlying data. Many of the available imagery layers are updated within three hours of observation, which supports time-critical application areas such as wildfire management, air quality measurements, and flood monitoring. Worldview imagery is provided through NASA's Global Imagery Browse Services (GIBS). Worldview also includes geostationary imagery layers from the GOES-East, GOES-West, and Himawari-8 geostationary satellites that are available at 10-minute increments for the last 30 days.
Image
Download
AppEEARS: Application for Extracting and Exploring Analysis Ready Samples
The Application for Extracting and Exploring Analysis Ready Samples (AppEEARS) offers a simple and efficient way to access and transform geospatial data from a variety of federal data archives. AppEEARS enables users to subset geospatial datasets using spatial, temporal, and band/layer parameters. Two types of sample requests are available: point samples for geographic coordinates and area samples for spatial areas via vector polygons. Sample requests submitted to AppEEARS provide users not only with data values, but also associated quality data values. Interactive visualizations with summary statistics are provided for each sample within the application, which allow users to preview and interact with their samples before downloading their data. Visit the AppEEARS Getting Started to learn more about workflows, viewing the results, interacting with the results and downloading the requests.
ClimateSERV
The ClimateSERV data visualization tool enables users to visualize and download historical rainfall data, vegetation condition data, and 180-day forecasts of rainfall and temperature to improve understanding of, and make improved decisions for, issues related to agriculture and water availability. ClimateSERV offers an API for those who wish to incorporate their data into a separate application or script.
Image
Crop Condition and Soil Moisture Analytics (Crop-CASMA)
Crop Condition and Soil Moisture Analytics (Crop-CASMA) provides access to high-resolution data from NASA’s Soil Moisture Active Passive (SMAP) mission and the Moderate Resolution Imaging Spectroradiometer (MODIS) instrument in an easy-to-use format. Soil moisture data are critical for professionals in the agriculture and natural resources sectors who use soil moisture in tandem with other data to plan crop planting, forecast yields, track droughts or floods, and improve weather forecasts. This application offers a suite of services such as Web Map Service (WMS), Web Coverage Service (WCS), and Web Processing Services (WPS).
Earthdata Search is NASA's tool for searching for and discovering NASA Earth science data as well as relevant data available through U.S. and international agencies. Users can search for and read about data collections, search for data files by date and spatial area, preview browse images, and download or submit requests for data files, with customization for select data collections. Note: An Earthdata Login is required to download data.
Image
In the project area (for some datasets) users can customize granules. Users can reformat the data and output as HDF, NetCDF, ASCII, KML, or a GeoTIFF and can choose from a variety of projection options. Data can be subset to obtain only the bands that are needed.
Image
Famine Early Warning Systems Network (FEWS NET)
The Famine Early Warning Systems Network (FEWS NET) provides early warning and analysis on food insecurity. Created by the U.S. Agency for International Development (USAID) to help decision-makers plan for humanitarian crises, FEWS NET provides evidence-based analysis on more than 30 countries. The FEWS Net Land Data Assimilation System (FLDAS) is a custom instance of NASA's Land Information System (LIS) that has been adapted to work with domains, data streams, and monitoring and forecast requirements associated with food security assessment in data-sparse, developing-countries. The integration of LIS allows FEWS NET to leverage existing land surface models and generate ensembles of soil moisture, evapotranspiration (ET), and other variables based on multiple meteorological inputs or land surface models.
The USGS FEWS NET Data Portal provides access to geo-spatial data, satellite image products, and derived data products in support of FEWS NET drought monitoring efforts throughout the world. This portal is provided by the USGS FEWS NET Project, part of the Early Warning Focus Area at the USGS Earth Resources Observation and Science (EROS) Center.
Image
Giovanni
NASA’s Giovanni is an online application for the display and analysis of geophysical parameters. There are many options for analysis. For more information on choosing a type of plot, see the Giovanni User Manual. Note: An Earthdata Login is required for full Giovanni functionality.
Image
Single parameter analysis options include:
Lat–Lon map of time-averaged data
Map of a shaped region, such as country, watershed
Time-series of bounding box area-averaged data
Time-series of a shaped area-averaged data (country or watershed)
Hovmöllerdiagram/cross section map
Histogram
Vertical profile, cross-section map
Zonal mean
Animations of Lat–Lon map over time
Multi-year monthly averaged
Interannual Monthly or seasonal mean
Calculate accumulation (such as precipitation)
Multi-parameter analysis options include:
Scatter plots with regression statistics
Temporal correlation maps
Lat–Lon map overlain with 2nd parameter contour plot
Data recipe for downloading a Giovanni map as NetCDF and converting its data to quantifiable map data in the form of latitude-longitude-data value ASCII text
Provides WMS and WCS to other web servers to get maps or data from Giovanni
Global Agriculture Monitoring System (GLAM)
GLAM is a web-based platform that enables near-real-time monitoring of global croplands, primarily using NASA MODIS satellite data. This tool is being redesigned to incorporate new datasets and improve its speed, flexibility, and computing power.
OpenET is a web-based platform that puts NASA evapotranspiration (ET) data in the hands of farmers, water managers, and conservation groups to speed improvements and bring about innovation in water management across 17 states in the Western U.S. It uses publicly-available data and open-source models to deliver satellite-based ET information in areas as small as a quarter of an acre and at daily, monthly, and yearly intervals.
Image
Resources:
Overview of OpenET (video) To help comply with California's Sustainable Groundwater Management Act, the Rosedale-Rio Bravo Water Storage District built an online open-source groundwater accounting and trading platform using OpenET data. Data from OpenET let landowners track their annual water budget and help Rosedale track the water budget for the entire district.
Prediction Of Worldwide Energy Resources (POWER)
NASA's Prediction Of Worldwide Energy Resources (POWER) offers geospatially-enabled meteorology and solar-related parameters formulated for the agroclimatology community. It provides various widgets for mapping, analysis, and data download tools, as well as API services to access the POWER data holdings through custom scripts and scalable applications. The POWER Data Services consists of a series of restful Application Programming Interfaces (APIs), geospatial enabled image services, and Open-source Project for a Network Data Access Protocol (OPeNDAP) services. These three service offerings support data discovery, access, and distribution as Analysis Ready Data and as direct application inputs to decision-to-support tools.
NASA's Oak Ridge National Laboratory DAAC (ORNL DAAC) developed a Soil Moisture Visualizer tool (read about it at Soil Moisture Data Sets Become Fertile Ground for Applications) that integrates a variety of North American soil moisture datasets. The visualization tool incorporates in-situ, airborne, and remote sensing data into one easy-to-use platform. This integration helps to validate and calibrate the data and provides spatial and temporal data continuity. It also facilitates exploratory analysis and data discovery for different groups of users. The Soil Moisture Visualizer offers the capability to geographically subset and download time series data in .csv format. For more information on the available datasets and use of the visualizer, view the Soil Moisture Visualizer Guide.
To use the visualizer, select a dataset of interest under Data. Depending on the dataset chosen, the visualizer provides the included latitude/longitude or an actual site location name and relative time frames of data collection. Upon selecting a parameter, the tool displays a time series with available datasets. All measurements are volumetric soil moisture. Surface soil moisture is the daily average of measurements at 0-5 cm depth and root zone soil moisture (RZSM) is the daily average of measurements at 0-100 cm depth. The visualizer also provides data sources for download.
Image
The Soil Moisture Visualizer allows users to compare soil moisture measurements from multiple sources at the same location. In this screenshot, Level 4 Root Zone Soil Moisture (L4 RZSM) data acquired by NASA’s Soil Moisture Active Passive (SMAP) satellite are shown with data from in situ sensors across the 9-kilometer Equal-Area Scalable Earth (EASE) grid cell encompassing the Tonzi Ranch Fluxnet site in the Sierra Nevada foothills of California, USA. Daily precipitation values for the site (purple spikes) are also provided for reference. Credit: NASA ORNL DAAC.
U.S. Drought Monitor
The U.S. Drought Monitor is a weekly map of drought conditions used by policymakers to help determine drought relief allocations and declarations of drought. NASA satellites provide data about water availability to the U.S. Drought Monitor.
Image
USGS GFSAD Cropland Data
This USGS GFSAD Cropland Data visualization tool by the USGS provides the Global Food Security Analysis-Support Data at 30 Meters (GFSAD30) visualizing nearly 1.874 billion hectares (roughly 12.6% of the global terrestrial area) of global croplands.
The Agrometeorological (AGMET) Earth Observations (EO) Indicators bring together a variety of EO data products on the sub-national scale, each of which provides valuable insights on in-season crop development and current crop conditions. Each AGMET Indicator consists of several EO data plots that quantify critical indicators related to crop health for a specific region and crop over time and are updated every 7-12 days. Combined, the different EO data plots help tell the story of in-season crop conditions through the use of different climate, environmental, and vegetative variables.
A Guide to NASA's GIS Agriculture Resources and Data
Discover the NASA Earth Science resources that give insight to agricultural applications. The data found in this web map can be applied to the following areas:
Water Availability: Plant Stress, Soil Moisture, Drought, Irrigation Weather, Extreme Events and Better Seasonal and Sub-Seasonal Projections: NASA Models Informing NOAA, USDA and Drought Monitor Operational Forecasting
For GIS users: see how to use NASA data and services in common GIS tools in the GIS Pathfinder and check out the How To guides to get help with your workflows.
Image
Data layers showing rainfall, evaporative stress, and more in the Agriculture GIS Web Map. Credit: NASA
ClimateSERV
The ClimateSERV data visualization tool enables users to visualize and download historical rainfall data, vegetation condition data, and 180-day forecasts of rainfall and temperature to improve understanding of, and make improved decisions for, issues related to agriculture and water availability. ClimateSERV offers an API for those who wish to incorporate their data into a separate application or script.
Image
Crop Condition and Soil Moisture Analytics (Crop-CASMA)
Crop Condition and Soil Moisture Analytics (Crop-CASMA) provides access to high-resolution data from NASA’s Soil Moisture Active Passive (SMAP) mission and the Moderate Resolution Imaging Spectroradiometer (MODIS) instrument in an easy-to-use format. Soil moisture data are critical for professionals in the agriculture and natural resources sectors who use soil moisture in tandem with other data to plan crop planting, forecast yields, track droughts or floods, and improve weather forecasts. This application offers a suite of services such as Web Map Service (WMS), Web Coverage Service (WCS), and Web Processing Services (WPS).
NASA’s Giovanni is an online application for the display and analysis of geophysical parameters. There are many options for analysis. For more information on choosing a type of plot, see the Giovanni User Manual. Note: An Earthdata Login is required for full Giovanni functionality.
Image
Single parameter analysis options include:
Lat–Lon map of time-averaged data
Map of a shaped region, such as country, watershed
Time-series of bounding box area-averaged data
Time-series of a shaped area-averaged data (country or watershed)
Hovmöllerdiagram/cross section map
Histogram
Vertical profile, cross-section map
Zonal mean
Animations of Lat–Lon map over time
Multi-year monthly averaged
Interannual Monthly or seasonal mean
Calculate accumulation (such as precipitation)
Multi-parameter analysis options include:
Scatter plots with regression statistics
Temporal correlation maps
Lat–Lon map overlain with 2nd parameter contour plot
Data recipe for downloading a Giovanni map as NetCDF and converting its data to quantifiable map data in the form of latitude-longitude-data value ASCII text
Provides WMS and WCS to other web servers to get maps or data from Giovanni
Global Agriculture Monitoring System (GLAM)
GLAM is a web-based platform that enables near-real-time monitoring of global croplands, primarily using NASA MODIS satellite data. This tool is being redesigned to incorporate new datasets and improve its speed, flexibility, and computing power.
NetCDF, HDF, GRIB, and other datasets can be viewed using NASA’s Panoply data viewer. Panoply is a cross-platform application that plots geo-referenced and other arrays, and offers additional functionality such as slicing and plotting arrays, combining arrays, and exporting plots and animations. Panoply is a cross-platform application that runs on Macintosh, Windows, Linux and other desktop computers. Panoply requires that your computer has have had a compatible Java 11 (or later version) JRE or JDK installed.
Image
With Panoply 5 you can:
Create color contour plots of geo-referenced latitude-longitude, latitude-vertical, longitude-vertical, time-latitude or time-vertical arrays sliced from 2D or larger multidimensional variables
Create color contour plots of "generic" 2D arrays from 2D or larger multidimensional variables
Create line plots of data from 1D or larger multidimensional variables
Combine two geo-referenced arrays in one plot by differencing, summing or averaging
Create map plots of trajectory data based on the CF convention or similar
Plot lon-lat data on a global or regional map using any of over 200 map projections or make a zonal average line plot
Overlay continent outlines or masks on lon-lat map plots
Use any of numerous color tables for the scale colorbar, or apply your own custom ACT, CPT, or RGB color table
Save plots to disk GIF, JPEG, PNG or TIFF bitmap images or as PDF or PostScript graphics files
Export lon-lat map plots in KMZ format
Open remote netCDF and HDF dataset stored on an HTTP/HTTPS website or in an S3 bucket
Explore remote THREDDS and OPenDAP catalogs and open datasets served from them
Export animations as MP4 video or as a collection of individual frame images
NASA's Prediction Of Worldwide Energy Resources (POWER) offers geospatially-enabled meteorology and solar-related parameters formulated for the agroclimatology community. It provides various widgets for mapping, analysis, and data download tools, as well as API services to access the POWER data holdings through custom scripts and scalable applications. The POWER Data Services consists of a series of restful Application Programming Interfaces (APIs), geospatial enabled image services, and Open-source Project for a Network Data Access Protocol (OPeNDAP) services. These three service offerings support data discovery, access, and distribution as Analysis Ready Data and as direct application inputs to decision-to-support tools.
OpenET is a web-based platform that puts NASA evapotranspiration (ET) data in the hands of farmers, water managers, and conservation groups to speed improvements and bring about innovation in water management across 17 states in the Western U.S. It uses publicly-available data and open-source models to deliver satellite-based ET information in areas as small as a quarter of an acre and at daily, monthly, and yearly intervals.
Image
Resources:
Overview of OpenET (video) To help comply with California's Sustainable Groundwater Management Act, the Rosedale-Rio Bravo Water Storage District built an online open-source groundwater accounting and trading platform using OpenET data. Data from OpenET let landowners track their annual water budget and help Rosedale track the water budget for the entire district.
U.S. Drought Monitor
The U.S. Drought Monitor is a weekly map of drought conditions used by policymakers to help determine drought relief allocations and declarations of drought. NASA satellites provide data about water availability to the U.S. Drought Monitor.
Image
For Developers
ClimateSERV
The ClimateSERV data visualization tool enables users to visualize and download historical rainfall data, vegetation condition data, and 180-day forecasts of rainfall and temperature to improve understanding of, and make improved decisions for, issues related to agriculture and water availability. ClimateSERV offers an API for those who wish to incorporate their data into a separate application or script.
Image
Crop Condition and Soil Moisture Analytics (Crop-CASMA)
Crop Condition and Soil Moisture Analytics (Crop-CASMA) provides access to high-resolution data from NASA’s Soil Moisture Active Passive (SMAP) mission and the Moderate Resolution Imaging Spectroradiometer (MODIS) instrument in an easy-to-use format. Soil moisture data are critical for professionals in the agriculture and natural resources sectors who use soil moisture in tandem with other data to plan crop planting, forecast yields, track droughts or floods, and improve weather forecasts. This application offers a suite of services such as Web Map Service (WMS), Web Coverage Service (WCS), and Web Processing Services (WPS).
NASA’s Giovanni is an online application for the display and analysis of geophysical parameters. There are many options for analysis. For more information on choosing a type of plot, see the Giovanni User Manual. Note: An Earthdata Login is required for full Giovanni functionality.
Image
Single parameter analysis options include:
Lat–Lon map of time-averaged data
Map of a shaped region, such as country, watershed
Time-series of bounding box area-averaged data
Time-series of a shaped area-averaged data (country or watershed)
Hovmöllerdiagram/cross section map
Histogram
Vertical profile, cross-section map
Zonal mean
Animations of Lat–Lon map over time
Multi-year monthly averaged
Interannual Monthly or seasonal mean
Calculate accumulation (such as precipitation)
Multi-parameter analysis options include:
Scatter plots with regression statistics
Temporal correlation maps
Lat–Lon map overlain with 2nd parameter contour plot
Data recipe for downloading a Giovanni map as NetCDF and converting its data to quantifiable map data in the form of latitude-longitude-data value ASCII text
Provides WMS and WCS to other web servers to get maps or data from Giovanni
Global Agriculture Monitoring System (GLAM)
GLAM is a web-based platform that enables near-real-time monitoring of global croplands, primarily using NASA MODIS satellite data. This tool is being redesigned to incorporate new datasets and improve its speed, flexibility, and computing power.
NASA's Prediction Of Worldwide Energy Resources (POWER) offers geospatially-enabled meteorology and solar-related parameters formulated for the agroclimatology community. It provides various widgets for mapping, analysis, and data download tools, as well as API services to access the POWER data holdings through custom scripts and scalable applications. The POWER Data Services consists of a series of restful Application Programming Interfaces (APIs), geospatial enabled image services, and Open-source Project for a Network Data Access Protocol (OPeNDAP) services. These three service offerings support data discovery, access, and distribution as Analysis Ready Data and as direct application inputs to decision-to-support tools.
NASA Resources for Agriculture and Water Management Applications
NASA develops partnerships and resources to address food security and works with decision-makers and data users to tailor these tools to specific locations and user needs. These efforts help address issues like water management for irrigation, crop-type identification and land use, coastal and lake water quality monitoring, drought preparedness, and famine early warnings. NASA Earth science data are key elements in the work carried out and supported by the agency's Applied Sciences Program, which works with individuals and institutions worldwide to inform decision-making, enhance quality of life, and strengthen our economy.
Applied Sciences agriculture and water management-related efforts include:
NASA Harvest: A multidisciplinary consortium commissioned by NASA and led by the University of Maryland to enhance the use of satellite data in decision-making related to food security and agriculture domestically and globally
Water Resources program area helps discover, develop, and demonstrate new practical uses for NASA's Earth observations in the water resources management community, and works with a wide range of global partners to find innovative solutions as shifts in land use, changing climates, and growing populations stress water supplies
Connection of Sustainable Development Goals to Agriculture and Water Management
The Sustainable Development Goals (SDGs) are a collection of 17 interlinked global goals designed to be a blueprint for a sustainable future for all of Earth’s inhabitants. The SDGs are part of the 2030 Agenda for Sustainable Development, an international plan signed by all United Nations (UN) member states and underpinned by the foundational components of People, Planet, and Prosperity.
Image
SDGs include specific social, economic, and environmental targets. Through SDG 2: Zero Hunger, the UN proposes to end hunger, achieve food security and improved nutrition, and promote sustainable agriculture. Key SDG 2 Targets include:
End hunger and ensure access by all people to safe, nutritious, and sufficient food
Double the agricultural productivity and incomes of small-scale food producers through secure and equal access to land, other productive resources and inputs, knowledge, financial services, markets, and opportunities
Ensure sustainable food production systems and implement resilient agricultural practices that increase productivity and production; that help maintain ecosystems; that strengthen capacity for adaptation to climate change, extreme weather, drought, flooding, and other disasters; and that progressively improve land and soil quality
While NASA datasets are not official indicators for SDG monitoring and decision-making, they provide data necessary to assess progress towards achieving SDG Targets. Along with SDG 2, the data and resources in the Agriculture and Water Management Data Pathfinder help address Targets in other SDGs, including:
SDG
SDG Goals Relevant to Agriculture and Water Management
Image
Ensure availability and sustainable management of water and sanitation for all
Substantially increase water-use efficiency across all sectors and ensure sustainable withdrawals and supply of freshwater to address water scarcity and substantially reduce the number of people suffering from water scarcity
Implement integrated water resources management at all levels, including through transboundary cooperation, as appropriate
Image
Promote sustained, inclusive, and sustainable economic growth, full and productive employment, and decent work for all
Progressively improve global resource efficiency in consumption and production and endeavor to decouple economic growth from environmental degradation with developed countries taking the lead
Image
Ensure sustainable consumption and production patterns
Achieve the environmentally sound management of chemicals and all wastes throughout their life cycle and significantly reduce their release to air, water, and soil in order to minimize their adverse impacts on human health and the environment
Image
Take urgent action to combat climate change and its impacts
Strengthen resilience and adaptive capacity to climate-related hazards and natural disasters in all countries
Integrate climate change measures into national policies, strategies, and planning
Image
Protect, restore, and promote sustainable use of terrestrial ecosystems, sustainably manage forests, combat desertification and reverse land degradation, and halt biodiversity loss
Combat desertification, restore degraded land and soil, including land affected by desertification, drought and floods, and strive to achieve a land degradation-neutral world
GIS data related to SDG 2 are available from the United Nations Statistics Division through Esri’s Federated Information System for the SDG Initiative.


 Earth Observations (EO) Indicators")

 provides access to high-resolution data from NASA’s Soil Moisture Active Passive (SMAP) mission and the Moderate Resolution Imaging Spectroradiometer (MODIS) instrument")


")


 offers a variety of services for accessing geospatially enabled meteorology and solar-related parameters formulated for the agroclimatology community.")


 Logo")