NASA Earth Science Data Roundup: September 2023
NASA’s ASF DAAC announced the availability of global mosaics and maps created with data acquired by the Japan Aerospace Exploration Agency's (JAXA) Japanese Earth Resources Satellite (JERS-1) and Advanced Land Observing Satellites (ALOS-1 and ALOS-2). These free and open Synthetic Aperture Radar (SAR) datasets are intended to enhance the scientific community’s understanding of global environmental changes, including deforestation and forest degradation.
The L-band SAR data used to produce the mosaics and maps have been radiometrically terrain corrected to remove geometric distortions and topographic effects. The mosaics are compiled from acquisition swaths, and improved processing techniques make them as seamless as possible. The maps define areas of forest and non-forest and are useful for detecting changes in forested land cover over time.
Global SAR Mosaic information and data access
Atmospheric Science Data Center (ASDC)
SOLVE Data Released
NASA’s ASDC released data for the SAGE III Ozone Loss and Validation Experiment (SOLVE) campaign, which aimed to calibrate and validate measurements from the Stratospheric Aerosol and Gas Experiment (SAGE) III satellite, while examining the processes that controlled ozone levels at mid- to high-latitudes. Measurements were made in the Arctic high-latitude region in winter using the NASA DC-8 and ER-2 aircraft, as well as balloon platforms and ground-based instruments and collaborations with the German Aerospace Center’s Dassault Falcon aircraft.
The campaign was conducted in two phases. SOLVE I took place from fall 1999 to spring 2000 and featured 17 total flights. SOLVE II took place during the winter of 2003 and featured 11 flights. Nineteen data collections are available for SOLVE I and 13 collections are available for SOLVE II.
SOLVE data access and additional information
Level-1 and Atmosphere Archive and Distribution System Distributed Active Archive Center (LAADS DAAC)
New Version 6 AVHRR Long-Term Data Records Now Available
NASA's LAADS DAAC released new Long-Term Data Record Products (LTDR), Version 6, using data from the Advanced Very-High-Resolution Radiometer (AVHRR).
The new LTDR products incorporate data from eight AVHRR missions (MetOp-B, NOAA-19, NOAA-18, NOAA-16, NOAA-14, NOAA-11, NOAA-09, and NOAA-07) to create three data products: Atmospherically Corrected Normalized Difference Vegetation Index (NDVI) Daily L3 Global, Atmospherically Corrected Reflectance Daily L3 Global, and Top-of-Atmosphere Reflectance Daily L3 Global) per mission, for a total of 24 data products.
Version 6 AVHRR Long-Term Data Records access and additional information
Land Processes Distributed Active Archive Center (LP DAAC)
VIIRS Version 2 Leaf Area Index and Fraction of Photosynthetically Active Radiation Data Products Now Available
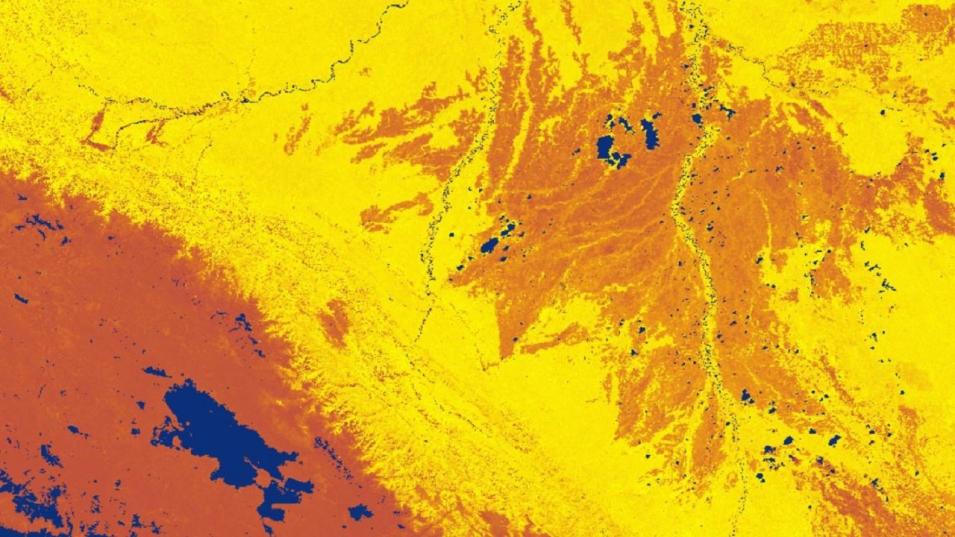
This image of the area in the vicinity of Peru’s Lake Titicaca (acquired June 29, 2023) shows data from the VIIRS FPAR Version 2 product. FPAR shows the fraction of incoming solar energy absorbed through photosynthesis. Areas in yellow correspond to the areas of greatest absorption while dark brown areas correspond to areas of the least absorption. Blue areas are water bodies. Credit: NASA's LP DAAC.
LP DAAC released the Visible Infrared Imaging Radiometer Suite (VIIRS) Version 2 Leaf Area Index (LAI) and Fraction of Photosynthetically Active Radiation (FPAR) product suite. The VIIRS Version 2 release, which covers the joint mission period from 2018 to the present, includes data products from the joint NASA/NOAA Suomi National Polar-orbiting Partnership (Suomi NPP) satellite and from the Joint Polar Satellite System’s NOAA-20 satellite (NOAA-20 acquires data approximately 50 minutes after Suomi NPP).
The Suomi NPP VIIRS LAI/FPAR Version 1 data product will remain available and will continue with forward processing alongside the Version 2 products.
VIIRS Version 2 LAI and FPAR data access and additional information
National Snow and Ice Data Center Distributed Active Archive Center (NSIDC DAAC)
NASA's NSIDC DAAC released several new datasets and updated versions of existing datasets.
New Datasets:
ATLAS/ICESat-2 Level 3B Slope-Corrected Land Ice Height Time Series, Version 6
Version 6 of the Level 3B Slope-Corrected Land Ice Height Time Series dataset is now available. Created from data acquired the Advanced Topographic Laser Altimeter System (ATLAS) aboard NASA's Ice, Cloud, and Land Elevation Satellite-2 (ICESat-2), this dataset provides time series data of land-ice surface heights derived from the ICESat-2 ATL06 Land Ice Height product. It is intended as an input for higher level gridded products, but it can also be used individually as a spatially organized product that enables easy access to height-change information derived from ICESat-2 observations. Changes to this version are detailed in the Version History section of the product user guide. Data now span March 29, 2019, to April 16, 2023.
The NSIDC DAAC will retire Version 5 of this dataset in six months, after which time Version 5 data will no longer be accessible. All related documentation will remain available on the dataset’s web page for future reference.
ATLAS/ICESat-2 Level 3B Daily and Monthly Gridded Sea Ice Freeboard, Version 4 and Daily and Monthly Gridded Polar Sea Surface Height Anomaly Version 3
The ATLAS/ICESat-2 Level 3B Daily and Monthly Gridded Sea Ice Freeboard, Version 4 and ATLAS/ICESat-2 Level 3B Daily and Monthly Gridded Polar Sea Surface Height Anomaly, Version 3 datasets are now available. These datasets contain daily and monthly gridded sea ice freeboard estimates and daily and monthly gridded polar sea surface height anomalies, derived from the along-track ATLAS/ICESat-2 Level 3A Sea Ice Height product. Changes with these versions are detailed in the Version History section of the product user guides. Temporal coverage for both datasets ranges from October 14, 2018, to April 1, 2023, with updates published regularly.
The NSIDC DAAC will retire the previous versions of these datasets in six months, after which time data from previous versions will no longer be accessible. All related documentation will remain available on the dataset web pages for future reference.
High Mountain Asia CMIP6 Monthly and Yearly Water Balance Projections (2016-2099) for Parts of Afghanistan, Tajikistan, Kyrgyzstan, and Pakistan Version 1
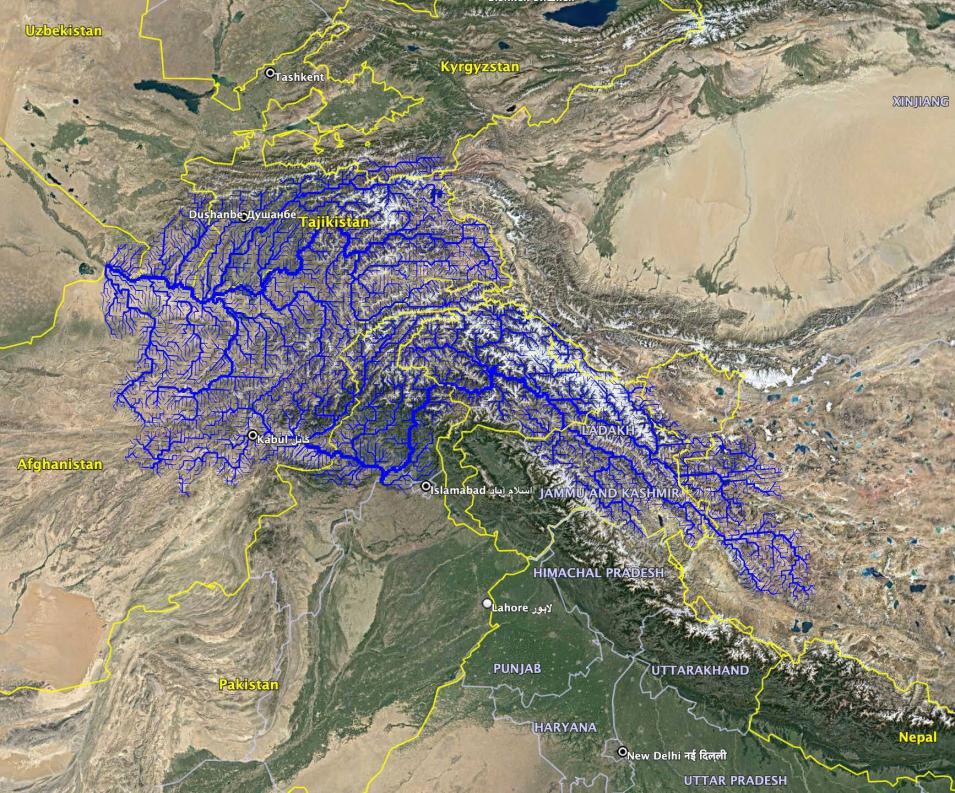
Image showing the geographical coverage for the High Mountain Asia CMIP6 Monthly and Yearly Water Balance Projections (2016–2099), which includes regions of Afghanistan, Tajikistan, Kyrgyzstan, and Pakistan (primarily the headwaters of the Amu Darya and Indus River basins). The river network is shown in blue. Credit: NASA's NSIDC DAAC.
The High Mountain Asia Coupled Model Intercomparison Project Phase 6 (CMIP6) Monthly and Yearly Water Balance Projections (2016-2099) for Parts of Afghanistan, Tajikistan, Kyrgyzstan, and Pakistan, Version 1 dataset is now available. This dataset comprises a suite of monthly and yearly water balance model (WBM) projections for the years 2016 to 2099 and covers parts of Afghanistan, Tajikistan, Kyrgyzstan, and Pakistan (primarily the headwaters of the Amu Darya and Indus River basins). Projections are available for 12 CMIP6 global climate models and two Shared Socioeconomic Pathways (SSP 2-4.5 and SSP 5-8.5). These projections were generated using the University of New Hampshire WBM. Additionally, a historical run is available for the years 1980 through 2018 that was generated from ERA5 reanalysis temperature data and ensemble precipitation estimates.
New Versions and Updates:
ATLAS/ICESat-2 L3A Sea Ice Height and Sea Ice Freeboard Version 6
Version 6 of the ATLAS/ICESat-2 Level 3A Sea Ice Height and ATLAS/ICESat-2 Level 3A Sea Ice Freeboard datasets are now available. These datasets contain along-track heights for sea ice and open water leads, and along-track sea ice freeboard estimates. Temporal coverage for these datasets ranges from October 14, 2018, to April 15, 2023.
The NSIDC DAAC will retire Version 5 of these datasets in six months, after which time Version 5 data will no longer be accessible. All related documentation will remain available on the dataset web page for future reference.
ATLAS/ICESat-2 L3A Sea Ice Height and Sea Ice Freeboard data access and additional information
Northern Hemisphere EASE-Grid 2.0 Weekly Snow Cover and Sea Ice Extent Version 4
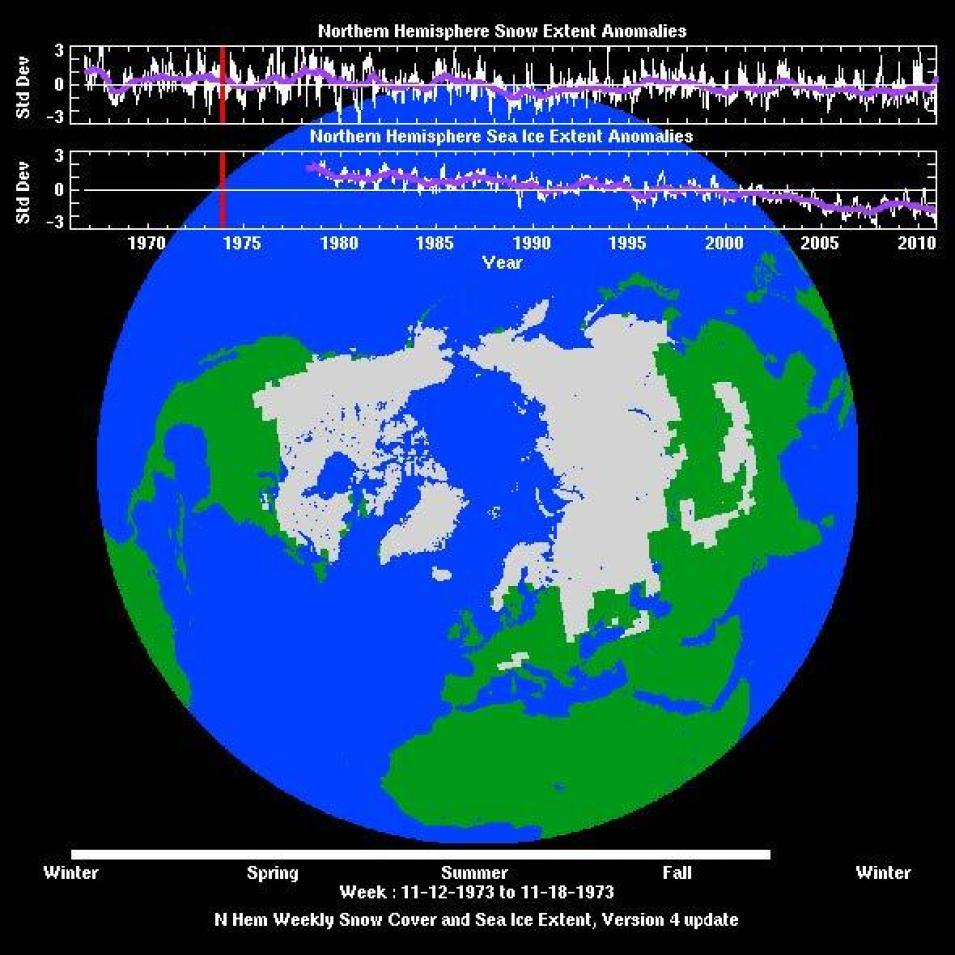
The Northern Hemisphere Equal-Area Scalable Earth (EASE)-Grid 2.0 Weekly Snow Cover and Sea Ice Extent Version 4 dataset has been updated through January 1, 2023. This dataset contains snow cover and sea ice extent derived from the Scanning Multichannel Microwave Radiometer (SMMR), which flew aboard NASA’s Seasat and Nimbus-7 satellites, and brightness temperature measurements from the Special Sensor Microwave/Imager (SMM/I) and Special Sensor Microwave Imager Sounder (SSMIS), which flew aboard the Defense Meteorological Satellite Program’s (DMSP) F-8, F-11, F-13, and F-17 satellites. These data are provided on the 25-kilometer Northern Hemisphere EASE-Grid 2.0.
SMAP Radiometer Twice-Daily rSIR-Enhanced EASE-Grid 2.0 Brightness Temperatures Version 2
The Soil Moisture Active Passive (SMAP) Radiometer Twice-Daily rSIR-Enhanced EASE-Grid 2.0 Brightness Temperatures Version 2 dataset has been updated to include new data from May 1, 2021, to December 31, 2022. This dataset contains twice-daily, enhanced-resolution brightness temperature data derived from the SMAP radiometer.
MEaSUREs Polar EASE-Grid 2.0 Daily 6 km Land Freeze/Thaw Status from AMSR-E and AMSR2 Version 2
The Making Earth System Data Records for Use in Research Environments (MEaSUREs) Polar EASE-Grid 2.0 Daily 6-kilometer Land Freeze/Thaw Status from the Advanced Microwave Scanning Radiometer for EOS (AMSR-E) and Advanced Microwave Scanning Radiometer 2 (AMSR2) Version 2 dataset has been updated through December 31, 2021. The daily GeoTIFF files from 2002 to 2020 have been replaced. Although the data in these files have not been modified, the file metadata have been updated to comply with a new standard for all daily GeoTIFF files, starting with the 2021 temporal coverage extension. The updated GeoTIFF files (and all new daily GeoTIFF files moving forward) can be identified by “v02.1” in their file names. This MEaSUREs Program dataset reports the global, daily freeze/thaw status of the landscape at 6-kilometer resolution on EASE-Grid 2.0 Northern Hemisphere and Southern Hemisphere polar grids.
Snow Melt Onset Over Arctic Sea Ice from SMMR and SSM/I-SSMIS Brightness Temperatures Version 5
The Snow Melt Onset Over Arctic Sea Ice from SMMR and SSM/I-SSMIS Brightness Temperatures Version 5 dataset has been updated. The data are gridded to the 25-kilometer Northern Hemisphere Polar Stereographic projection and are available from 1979 through 2022. The dataset also includes yearly snow melt onset dates over Arctic sea ice derived from the Scanning Multichannel Microwave Radiometer (SMMR), the Special Sensor Microwave/Imager (SSM/I), and the Special Sensor Microwave Imager/Sounder (SSMIS) brightness temperature measurements.
Physical Oceanography Distributed Active Archive Center (PO.DAAC)
NOAA GHRSST GOES-18 Advanced Baseline Imager Level 2P/L3C v2.90 Datasets Released
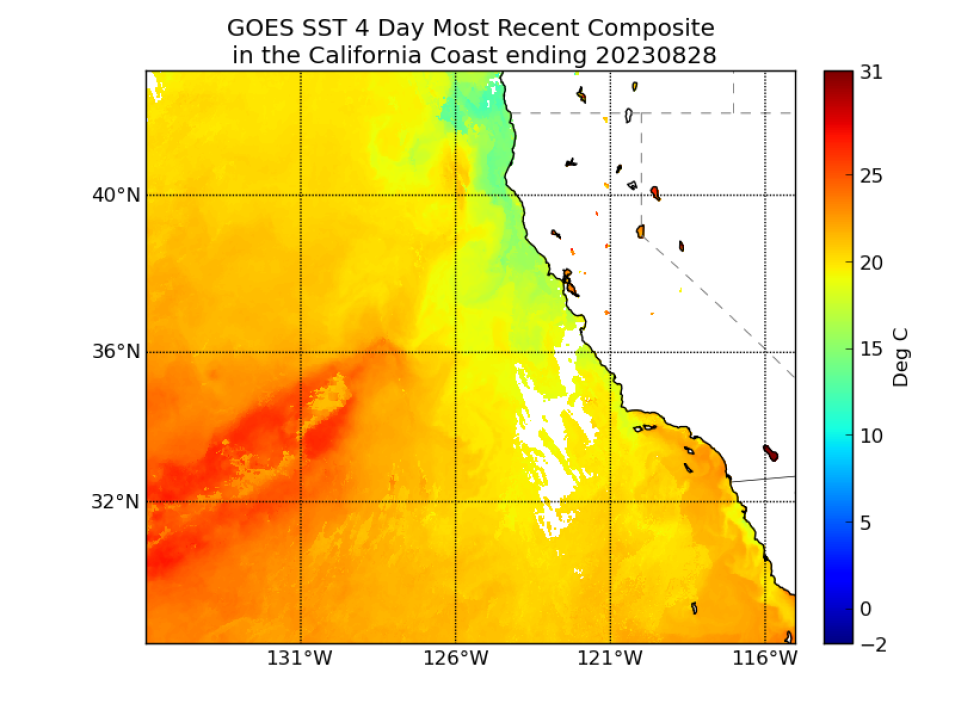
NASA’s PO.DAAC has announced the release of the NOAA Group for High Resolution Sea Surface Temperature (GHRSST) Advanced Baseline Imager (ABI) Level 2P and Level 3C v2.90 datasets from NOAA’s GOES-18 (GOES West) satellite.
The Level 2P Sea Surface Temperature (SST) dataset is produced in the instrument-native swath projection with 2-kilometer nadir spatial resolution. The Level 3C SST dataset is the gridded version of the Level 2P dataset. Both the Level 2P and Level 3C data are reported hourly, 24 granules per day, with a daily volume of 1.5 gigabytes per day. The near real-time (NRT) data are updated hourly, with several hours latency. The NRT files are replaced with Delayed Mode (DM) files, with a latency of about 2-months. Filenames remain unchanged, and DM and NRT files can be identified by different time stamps and global attributes inside the files.
The GOES-18 Level 2P and Level 3C data holdings in the PO.DAAC archive begin on July 11, 2023, and will be extended back to June 7, 2022, by September 2023. Both datasets are described and discoverable via the PO.DAAC dataset information pages and are accessible via the Cloud OPeNDAP and Harmony API services. PO.DAAC recommends that users download the data using the PO.DAAC Data Subscriber Python Tool.
Socioeconomic Data and Applications Center (SEDAC)
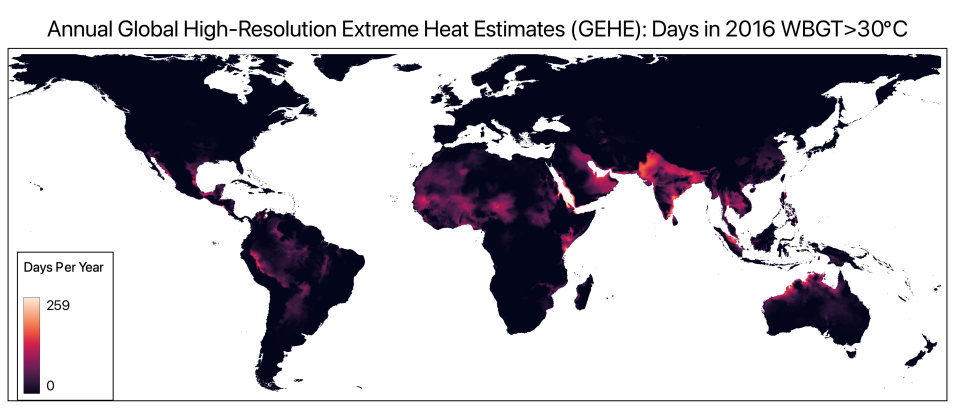
New Dataset: Annual Global High-Resolution Extreme Heat Estimates, Version 1 (1983 – 2016)
NASA's SEDAC released a new dataset, Annual Global High-Resolution Extreme Heat Estimates, Version 1 (1983 – 2016), that provides global 0.05 degrees (~5 kilometer) gridded annual counts of the number of days where the maximum Wet Bulb Globe Temperature (WBGT) exceeded dangerous hot-humid heat thresholds for the period 1983 to 2016. The thresholds are based on the International Standards Organization criteria for occupational heat-related risk, defined as days where the WBGT was greater than 28, 30, and 32 degrees Celsius. The dataset, which is the highest resolution dataset of its kind to date, also includes the annual rate of change in the number of extreme humid-heat days that exceeded these thresholds. This dataset was referenced in a recent article in the Washington Post, "Where Dangerous Heat Is Surging."
Annual Global High-Resolution Extreme Heat Estimates data access and more information
