Celebrate GIS Day 2024

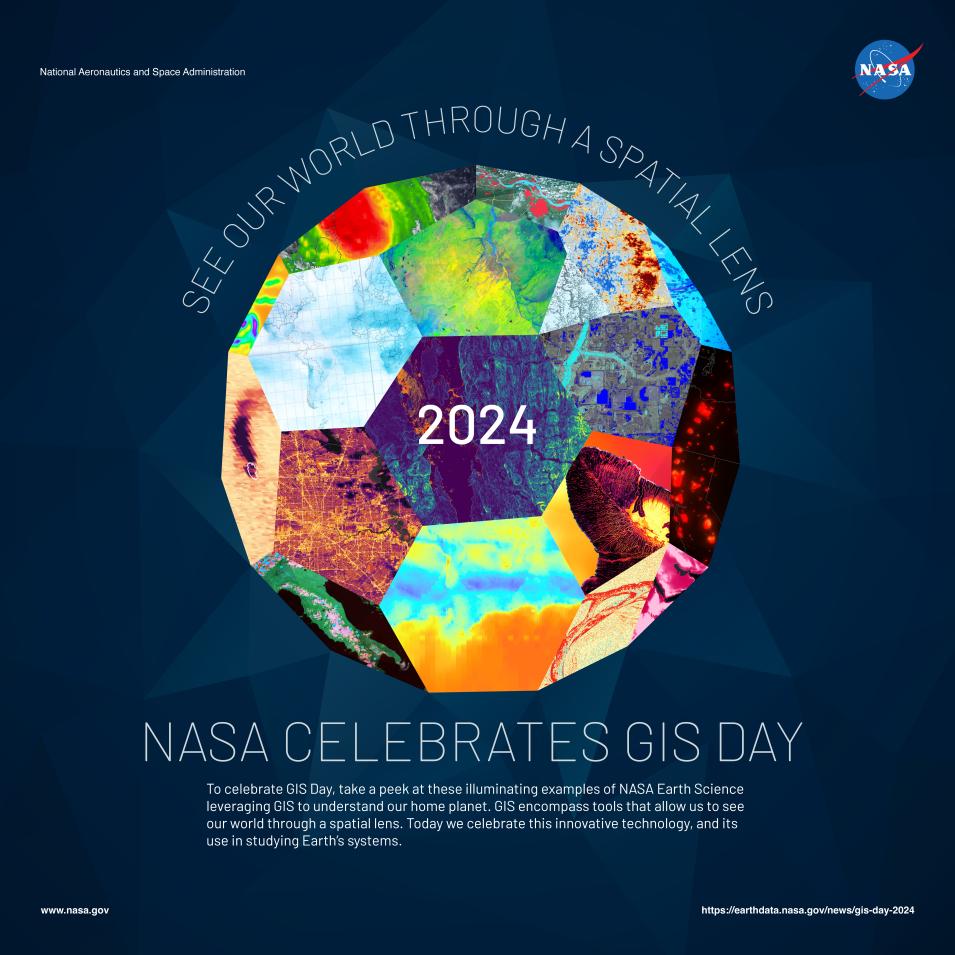
To celebrate GIS Day, take a peek at these illuminating examples of NASA Earth Science leveraging Geographic Information Systems (GIS) to understand our home planet.
Image
Image Caption

NASA's GIS Day 2024 graphic is composed of 18 individual images representing the many ways GIS is used to support Earth science. Learn more about each image in the list below.

Today is GIS Day, an opportunity for users across the globe to celebrate this powerful technology. GIS stands for Geographic Information Systems, which encompass tools that allow us to see our world through a spatial lens. GIS provides an intuitive way to store, visualize, and analyze geographic information to help us better understand patterns, trends, and phenomenon based on their location. At NASA, we use GIS to visualize Earth observation data collected from our fleet of satellites, often integrated alongside other information, to analyze relationships and study changes in areas across the globe.

All NASA data is free to discover, access, download, and use. We encourage you to explore the below GIS-centric projects, missions, tools, and applications, gathered to inspire you leverage GIS to better understand your home planet.
GIS in Action

Image
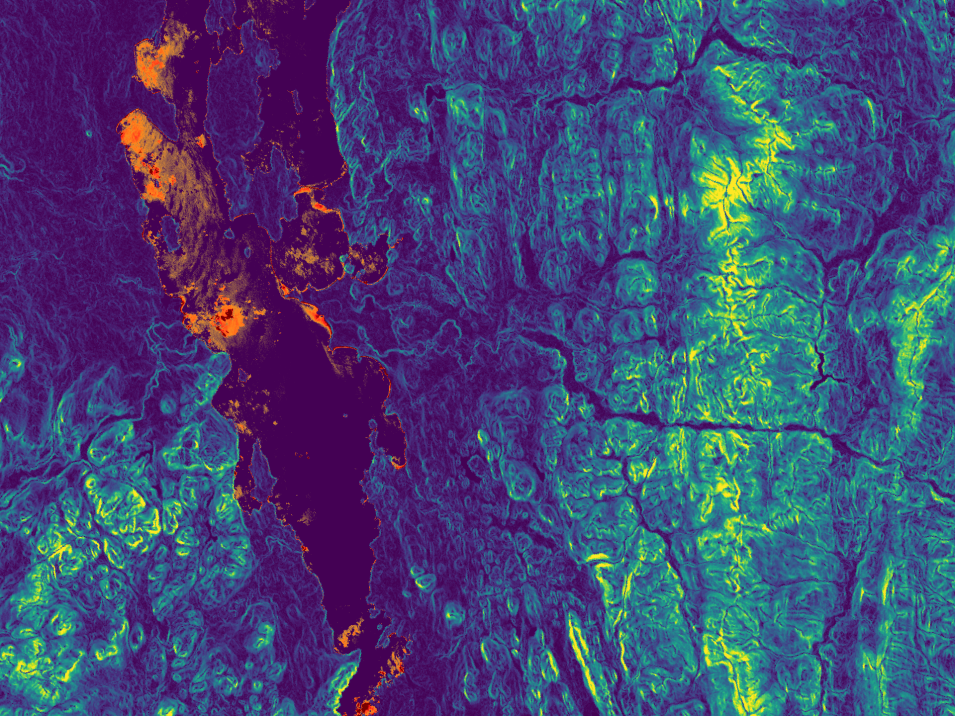
  • Title: Lake Champlain Turbidity Overlaid on Adjacent Slope Levels ​
  • NASA Platform/Instrument/Data Product(s) Featured: Landsat 8 Operational Land Imager (OLI) and the Shuttle Radar Topography Mission (SRTM) ​
  • Location: Lake Champlain, Vermont/New York ​
  • Date/Time: Landsat 8 Top of the Atmosphere (TOA) data (5/1/21 - 9/30/21); SRTM (flown 02/2000; last updated 11/2018) ​
  • Authors/Credits: Lake Champlain Water Resources DEVELOP Team (Laramie Plott, Ian Turner, Aaron Carr, Brianne Kendall) ​
  • Link: Using NASA Earth Observations to Identify Spatial and Seasonal Trends of Harmful Algal Events in Lake Champlain ​
Image
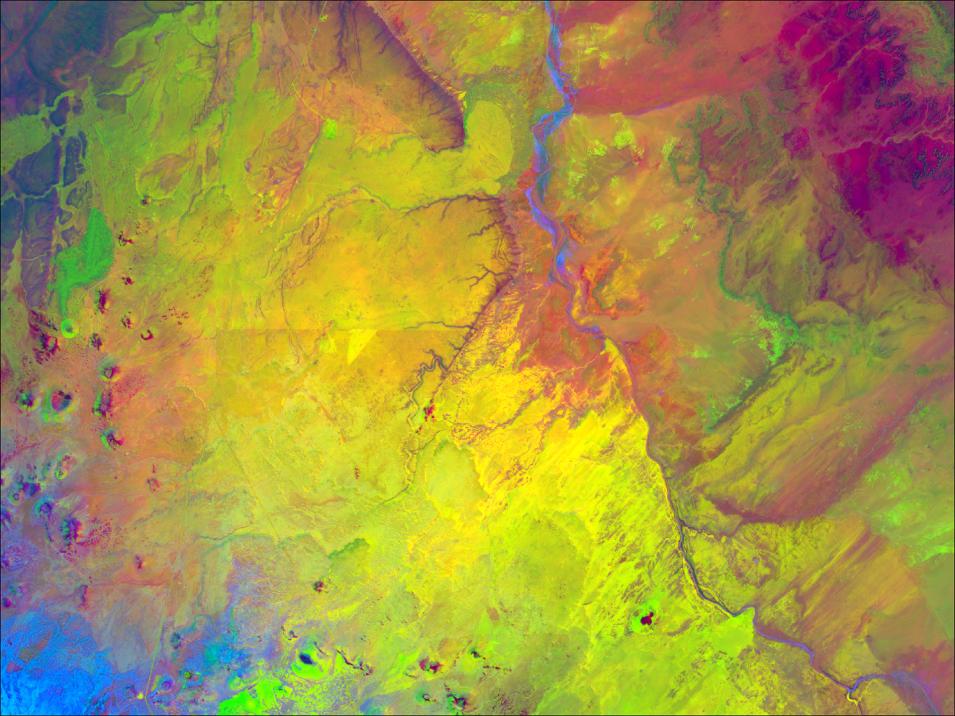
  • Title: Color composite image portraying the Thermal Infrared Band, the Modified Normalized Difference Water Index, and the Modified Soil-Adjusted Vegetation Index in Wupatki Basin, Arizona ​
  • NASA Platform/Instrument/Data Product(s) Featured: Landsat 8 Operational Land Imager (OLI) and Thermal Infrared Sensor (TIRS) imagery​
  • Location: Wupatki Basin, Northern Arizona ​
  • Date/Time: 2021​
  • Authors/Credits: Arizona Water Resources II Team (Arina Morozova, Jessica Birk, Jamal Jaffer, Greg Peargin) ​
  • Link: Utilizing NASA Earth Observations and Aerial Imagery to Assess Pinyon-Juniper Tree Mortality in Flagstaff, AZ
Image
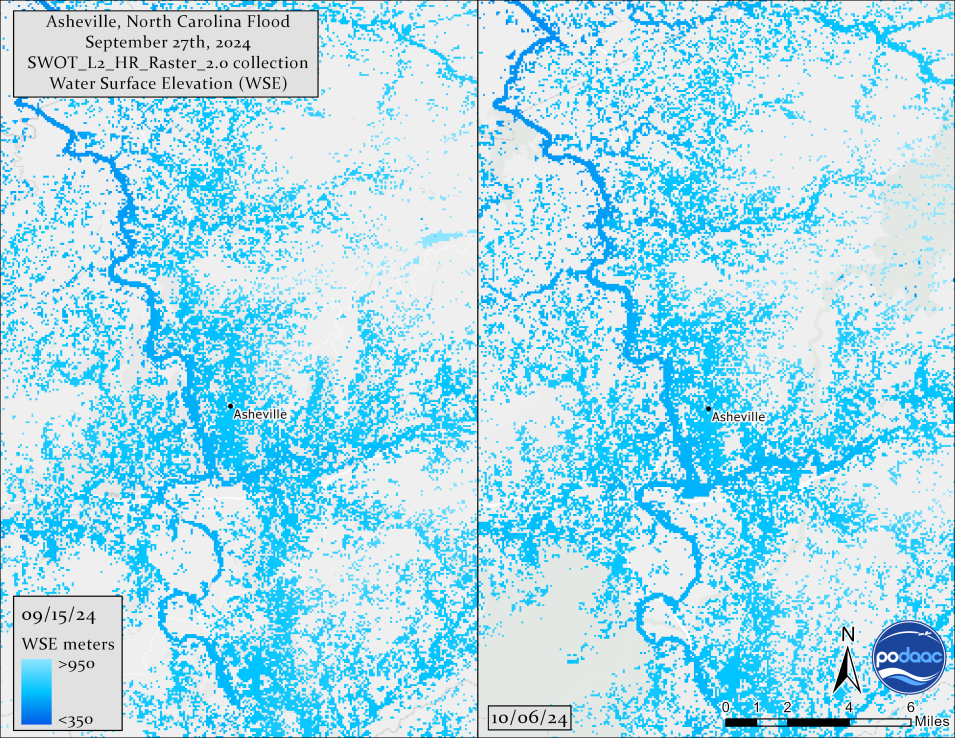
  • Title: Asheville North Carolina flood comparison map before and after utilizing SWOT Raster collection of Water Surface Elevation (WSE)​
  • NASA Platform/Instrument/Data Product(s) Featured: Surface Water Ocean Topography (SWOT) Level 2 River Single-Pass Vector Data Product (SWOT_L2_HR_RiverSP_2.0)​
  • Location: Asheville, North Carolina​
  • Date/Time: September 15, 2024, and October 6, 2024​
  • Authors/Credits: PO.DAAC Project, map created by Nicholas Tarpinian ​
  • Link: PO.DAAC data product used in this map
Image
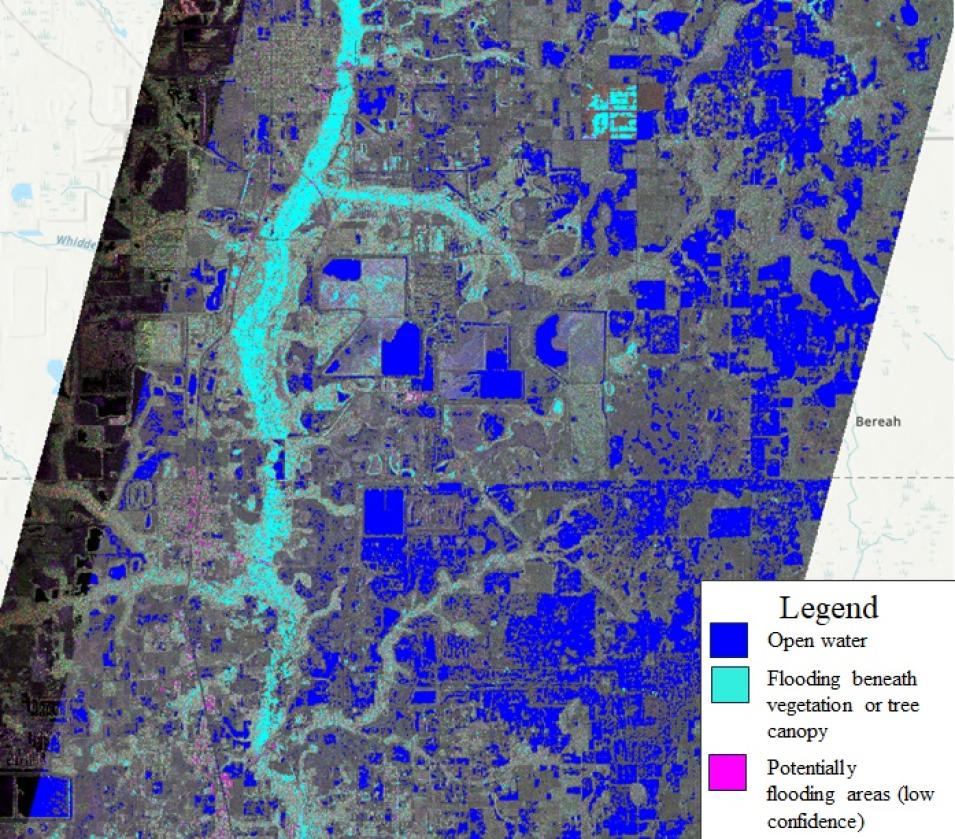
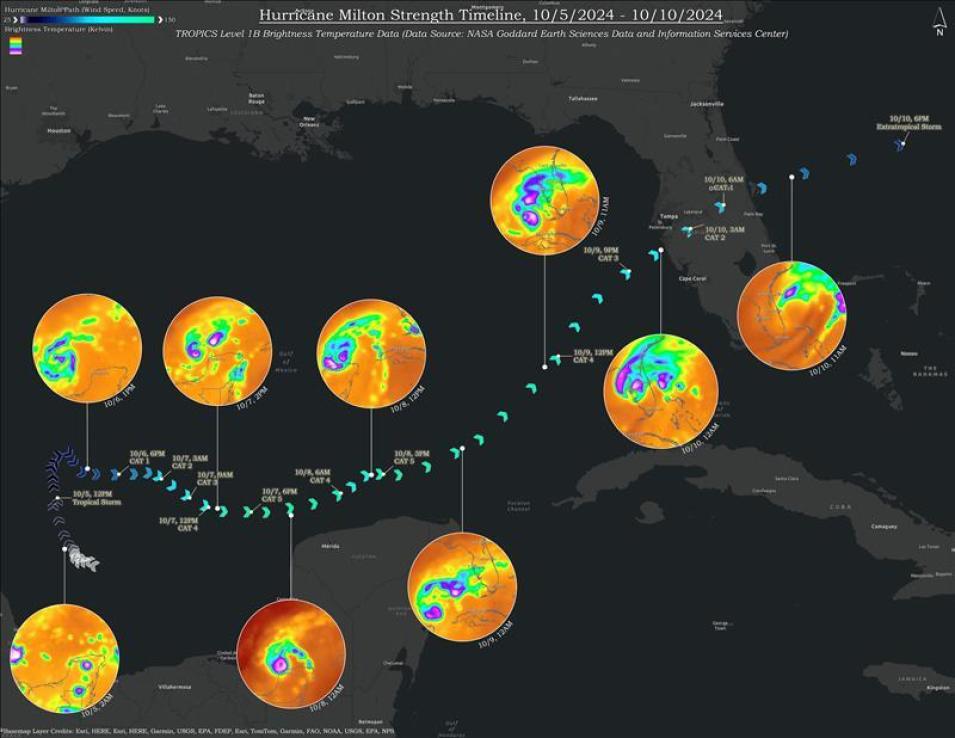
  • Title: UAVSAR Imagery after Hurricane Milton 2024​
  • NASA Platform/Instrument/Data Product(s) Featured: The Uninhabited Aerial Vehicle Synthetic Aperture Radar (UAVSAR) Airborne L-band Synthetic Aperture Radar (SAR) aboard a NASA Gulfstream C-20A jet​
  • Location: Central Florida​
  • Date/Time: Average over October 11, October 12, October 13, and October 14, 2024​
  • Authors/Credits: NASA Disasters Program, NASA/JPL-Caltech UAVSAR Team​
  • Link: UAVSAR Imagery for the St. Johns and Peace Rivers after Hurricane Milton 2024
Image
Image
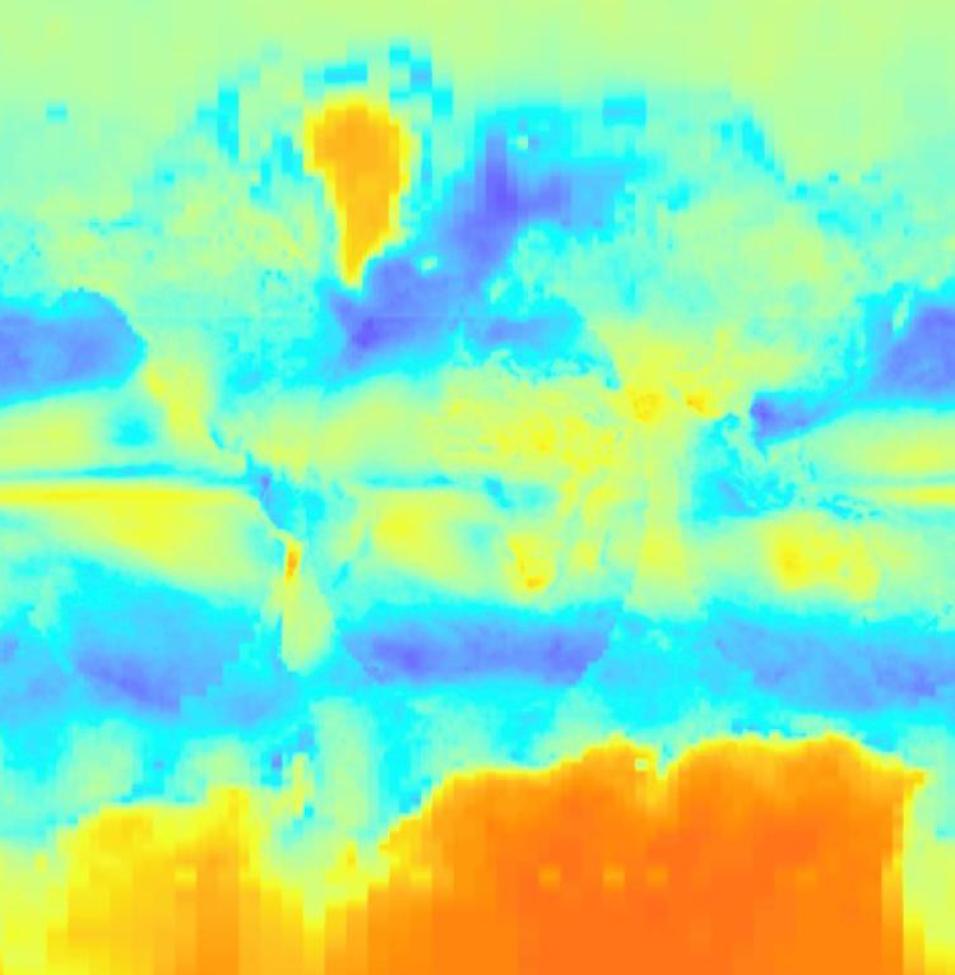
  • Title: Global view of annual radiation for 2022​
  • NASA Platform/Instrument/Data Product(s) Featured: All Sky Surface Shortwave Downward Irradiance from NASA's CERES SYN1deg Dataset​
  • Location: Global​
  • Date/Time: 2022 Average​
  • Authors/Credits: The Prediction of Worldwide Energy Resources (POWER) Project​
  • Links: POWER’s Homepage | POWER’s Data Access Viewer (DAV)
Image
  • Title: Assessing Power Outage Impacts in Houston, TX Following a Derecho Event​
  • NASA Platform/Instrument/Data Product(s) Featured: Black Marble HD product imagery generated using the Visible Infrared Imaging Radiometer Suite (VIIRS) instrument aboard the joint NASA/NOAA NOAA-20 satellite, Landsat, Open Street Maps​
  • Location: Houston, TX​
  • Date/Time: April (monthly composite) and May 18, 2024 ​
  • Authors/Credits: NASA's Black Marble Team​
  • Links: Black Marble Homepage | Earth Observatory Article
Image
  • Title: Global Monthly Average Total Cloud Cover Data Displayed from My NASA Data’s Earth System Data Explorer ​
  • NASA Platform/Instrument/Data Product(s) Featured: Terra-Aqua/CERES/CERES SYN1deg ​
  • Location: Global​
  • Date/Time: May 2023​
  • Authors/Credits: My NASA Data​
  • Link: My NASA Data’s Earth System Data Explorer
Image
  • Title: Flooding along the Ganges river in Bihar, India, September 2024, identified in NASA's MODIS NRT Global Flood Product​
  • NASA Platform/Instrument/Data Product(s) Featured: Moderate Resolution Imaging Spectroradiometer (MODIS) Near Real Time (NRT) Global Flood Product, 2-day product​
  • Location: Munger, Bihar State, India​
  • Date/Time: September 8, 2024​
  • Authors/Credits: The NASA Flood and Land, Atmosphere Near real-time Capability for Earth observation (LANCE)/MODAPS/Worldview teams​
  • Links: MODIS NRT Global Flood Product | Worldview Link to the Event
Image
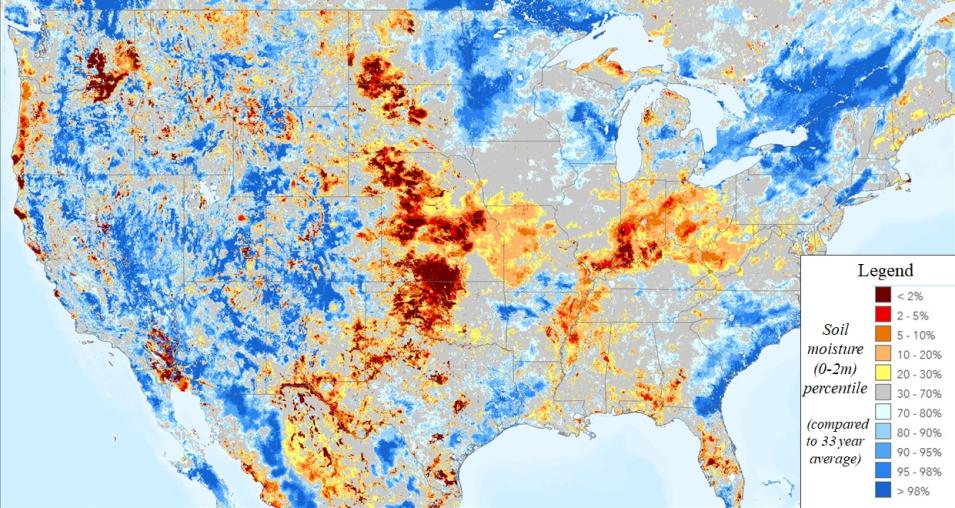
  • Title: Land Information System (LIS) Soil Moisture Product​
  • NASA Platform/Instrument/Data Product(s) Featured: NASA Land Information System (LIS) Land Surface Modeling and Data Assimilation System​
  • Location: Continental United States​
  • Date/Time: August 20, 2024​
  • Authors/Credits: NASA Disasters Program, MSFC SPoRT Center, NASA Land Information System​
  • Link: Land Information System (LIS) Web Map for the Southeast US, Updated Daily
Image
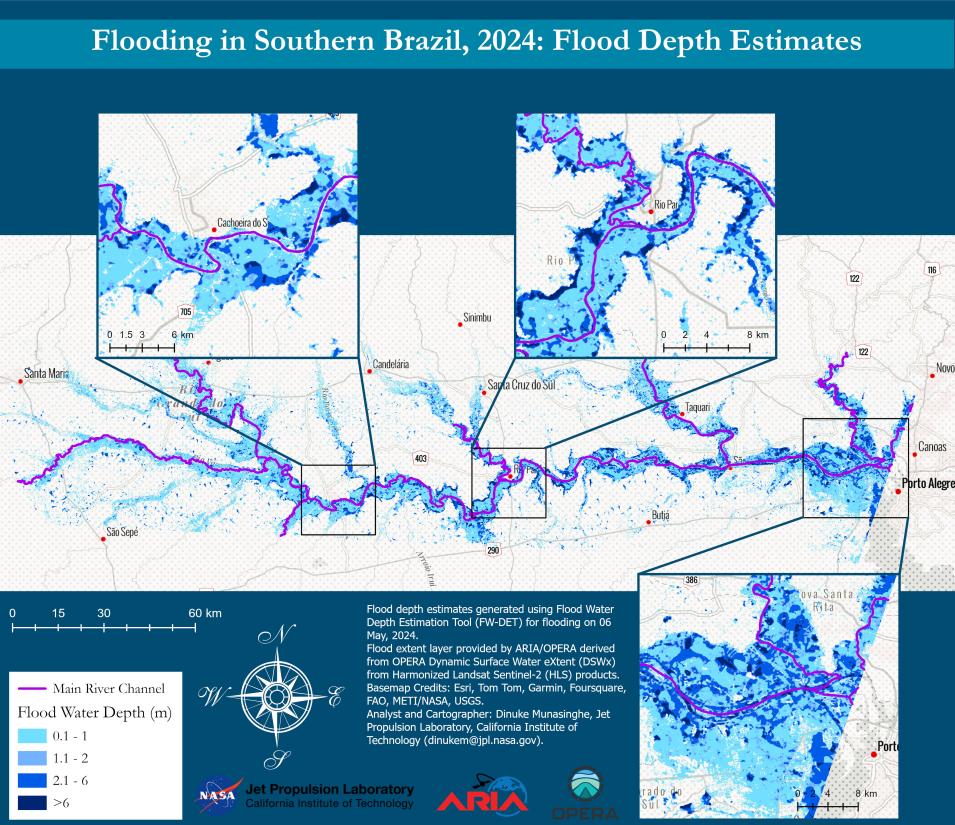
  • Title: Flooding in Southern Brazil, 2024: Flood Depth Estimates derived from NASA’s OPERA Surface Water Product​
  • NASA Platform/Instrument/Data Product(s) Featured: ​
    • Harmonized Landsat 8 and Sentinel-2 A/B​
    • OPERA Dynamic Surface Water eXtent fom Harmonized Landsat Sentinel-2 (DSWx-HLS) ​
    • NASA Shuttle Radar Topography Mission (SRTM) Digital Elevation 30 m​
    • Flood Water Depth Estimation Tool ​
  • Location: Porto Alegre (and surrounding region), Brazil​
  • Date/Time: May 6, 2024 ​
  • Authors/Credits: Dinuke Munasinghe (JPL, now at U of Alabama), Al Handwerger (JPL), ARIA/OPERA team at JPL​
  • Links: DSWx Product SuiteNASA Products for the May 2024 Flooding and Landslides in Brazil
Image
  • Title: 2020 Fire Season in the Western US​
  • NASA Platform/Instrument/Data Product(s) Featured: Visible Infrared Imaging Radiometer Suite (VIIRS) Sensors (Suomi NPP and NOAA-20) ​
  • Location: Western United States​
  • Date/Time: 2020​
  • Authors/Credits: Earth Information Systems (EIS) Fires​
  • Link: 2020 Fire Season in the Western US Dashboard
Image
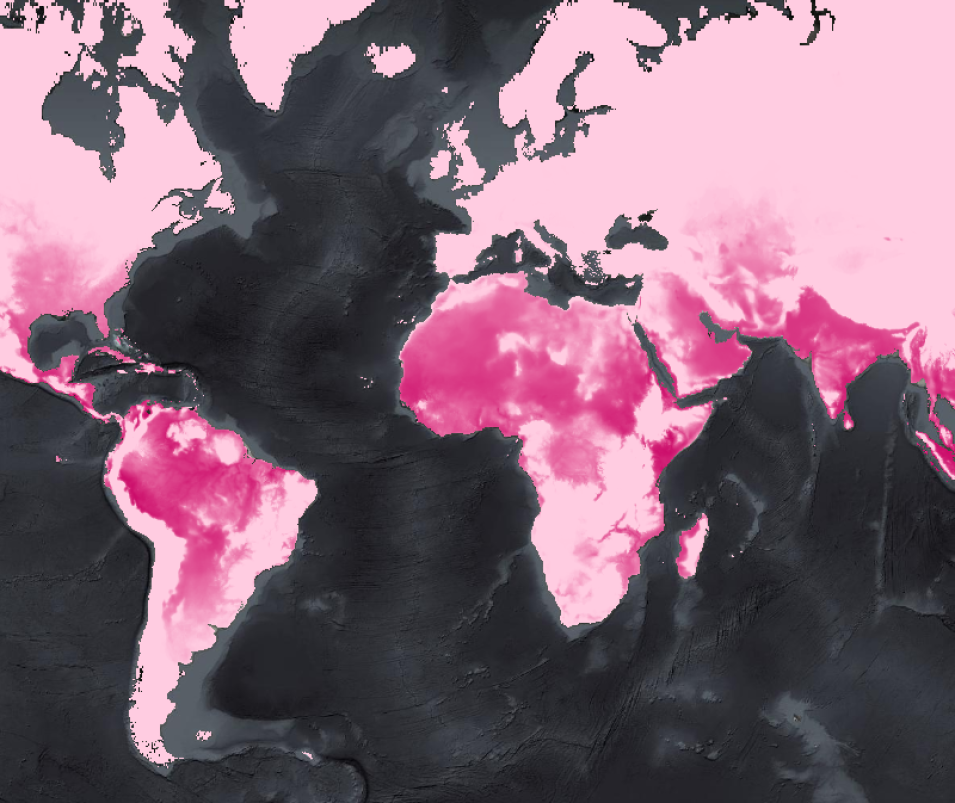
  • Title: Annual Global High-Resolution Extreme Heat Estimates (GEHE)​
  • NASA Platform/Instrument/Data Product(s) Featured: Annual Global High-Resolution Extreme Heat Estimates (GEHE), published by NASA Socioeconomic Data and Applications Center (SEDAC), version 1.00​
  • Location: Global​
  • Date/Time: 1982-1983​
  • Authors/Credits: Leah Schwizer, Earth Science Data Systems Geographic Information Systems Team (EGIST)​
  • Link: Annual Global High-Resolution Extreme Heat Estimates (GEHE), 1983-2016 Image Service
Image
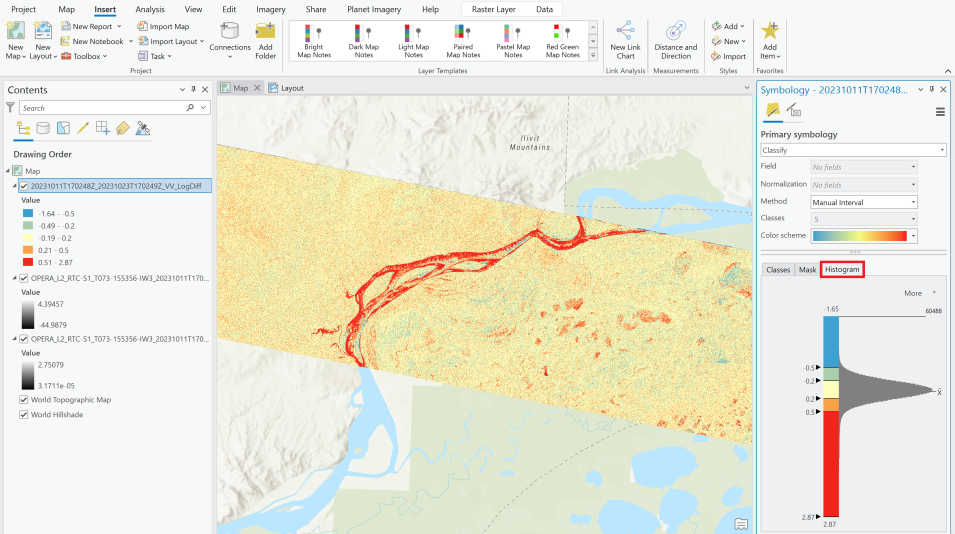
  • Title: Change detection image identifying development of ice on the Yukon River, set to use a classified symbology to quantify the magnitude of change​
  • NASA Platform/Instrument/Data Product(s) Featured: Log difference image generated using Observational Products for End-Users from Remote Sensing Analysis (OPERA) Level-2 Radiometric Terrain Corrected Synthetic Aperture Radar (SAR) Backscatter from Sentinel-1 products, processed by the OPERA project at JPL. Contains modified Copernicus Sentinel data, processed by the European Space Agency (ESA)
  • Location: Yukon River, Alaska​
  • Date/Time: October 2023​
  • Authors/Credits: Alaska Satellite Facility Distributed Active Archive Center (ASF DAAC), Heidi Kristenson​
  • Link: Change Detection using OPERA Sentinel-1 RTC StoryMap
Image
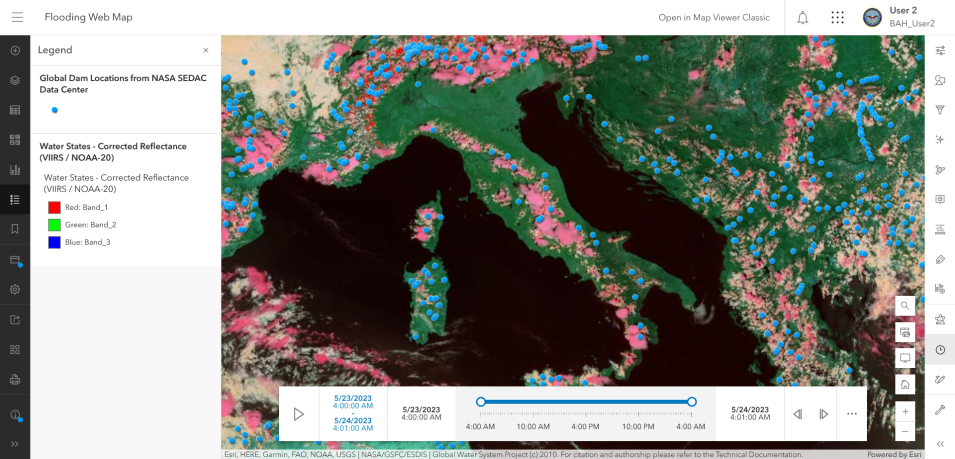
  • Title: Near Real-Time Monitoring of Heavy Rain and Flood Risk Hazards in Italy, May 2023
  • NASA Platform/Instrument/Data Product(s) Featured: The Global Precipitation Measurement (GPM) Near Real Time (NRT) 30-Minute Precipitation Accumulation, the Global Reservoir and Dam Database; Gridded Population of the World; Soil Moisture Anomaly 3-Day Composite; Flood Detection: 2 Day 2 Observations Composite; Corrected Reflectance from the Visible Infrared Imaging Radiometer Suite (VIIRS) onboard the Suomi National Polar-Orbiting Partnership (Suomi NPP)​
  • Location: Italy​
  • Date/Time: May 24, 2023​
  • Authors/Credits: The Earthdata GIS Team (EGIST)​
  • Link: Flooding Web Map - Overview
Image
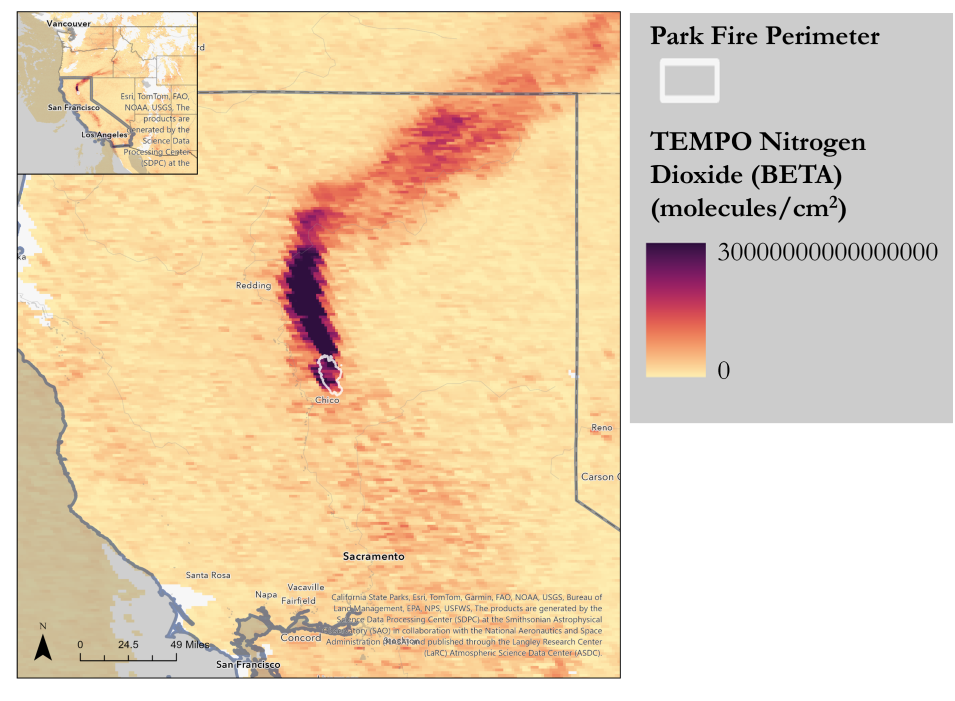
  • Title: Nitrogen Dioxide Plume from Park Fire in Northern California on July 25, 2024, Visible in TEMPO L3 NO2 BETA Data​
  • NASA Platform/Instrument/Data Product(s) Featured: Tropospheric Emissions: Monitoring of Pollution (TEMPO) Level 3 Nitrogen Dioxide (NO2) Beta Product​
  • Location: Northern California, USA​
  • Date/Time: July 25, 2024​
  • Authors/Credits:​
    • TEMPO data are generated by the Science Data Processing Center (SDPC) at the Smithsonian Astrophysical Observatory (SAO) in collaboration with NASA & published through the Langley Research Center (LaRC) Atmospheric Science Data Center (ASDC)​
    • Map – NASA Atmospheric Science Data Center (ASDC)​
  • Links: TEMPO NO2 Image Service | ASDC TEMPO Landing Page
Image
Image
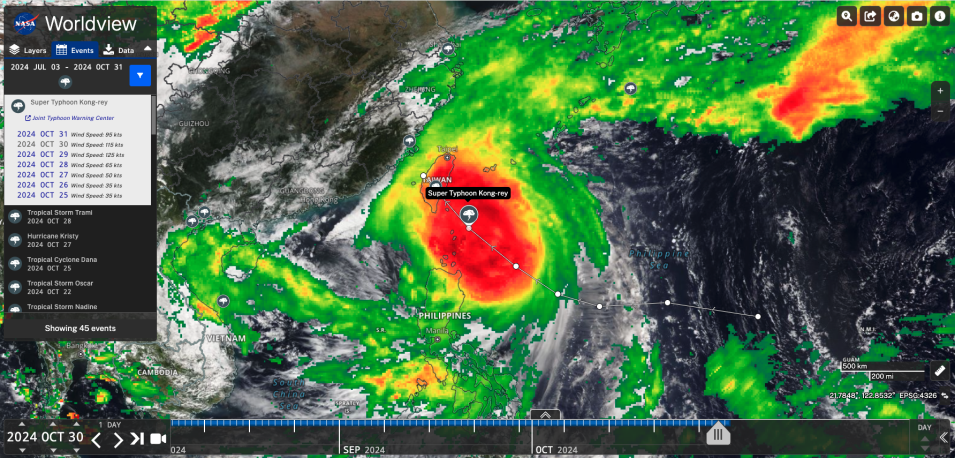
  • Title: Image of Super Typhoon Kong-rey approaching Taiwan shown in Worldview, overlaid with GPM/IMERG Precipitation Rate and storm track from the Joint Typhoon Warning Center provided through the Earth Observatory Natural Event Tracker​
  • NASA Platform/Instrument/Data Product(s) Featured: NOAA-21 Visible Infrared Imaging Radiometer Suite (VIIRS) Corrected Reflectance overlaid with Integrated Multi-satellitE Retrievals for GPM (Global Precipitation Measurement) (IMERG) Precipitation Rate​​
  • Location: Taiwan​
  • Date/Time: October 30, 2024​​
  • Authors/Credits: Worldview/GIBS Team​
  • Links: Link to the Event via Worldview | Earth Observatory Natural Event Tracker

Details

Last Updated

Published

Data Center/Project

Atmospheric Science Data Center (ASDC)
Alaska Satellite Facility DAAC (ASF DAAC)
Goddard Earth Sciences Data and Information Services Center (GES DISC)
Physical Oceanography DAAC (PO.DAAC)
Socioeconomic Data and Applications Center (SEDAC)