What is Synthetic Aperture Radar?

Synthetic aperture radar (SAR) is a type of active data collection where an instrument sends out a pulse of energy and then records the amount of that energy reflected back after it interacts with Earth. Unlike optical imagery, which is a passive data collection technique based on emitted energy, SAR imagery is created from the reaction of an emitted pulse of energy with physical structures (like mountains, forests, and sea ice) and conditions like soil moisture. SAR has been used in a wide range of applications, including studying Antarctic icebergs, tracking the paths of oil spills into sensitive marshes, and mapping the wetlands of Alaska.

What's Synthetic About Synthetic Aperture Radar?

The spatial resolution of radar data is directly related to the ratio of the sensor wavelength to the length of the sensor's antenna. For a given wavelength, the longer the antenna, the higher the spatial resolution. From a satellite in space operating at a wavelength of about 5 cm (C-band radar), in order to get a spatial resolution of 10 m, you would need a radar antenna about 4,250 m long. (That's over 47 football fields!)

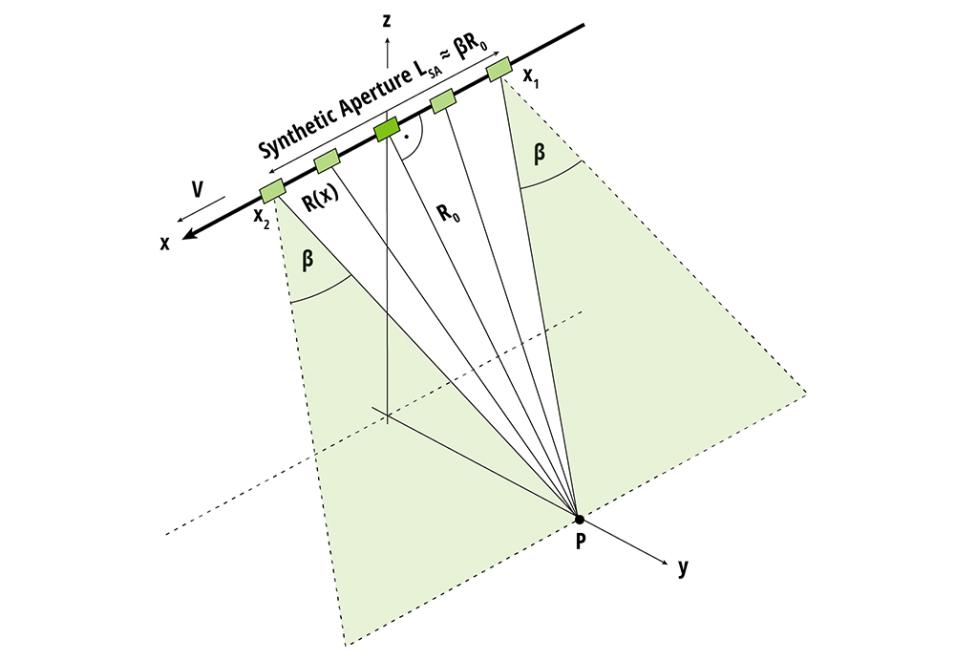
An antenna of that size is not practical for a satellite sensor in space. Hence, scientists and engineers came up with a clever workaround—the synthetic aperture. In this concept, a sequence of acquisitions from a shorter antenna are combined to simulate a much larger antenna, thus providing higher resolution data.

Geometry of observations used to form the synthetic aperture for target P at alongtrack position x = 0.
Image Caption

Geometry of observations used to form the synthetic aperture for target P at along-track position x = 0. Credit: NASA SAR Handbook.

Flight and Directional Terminology

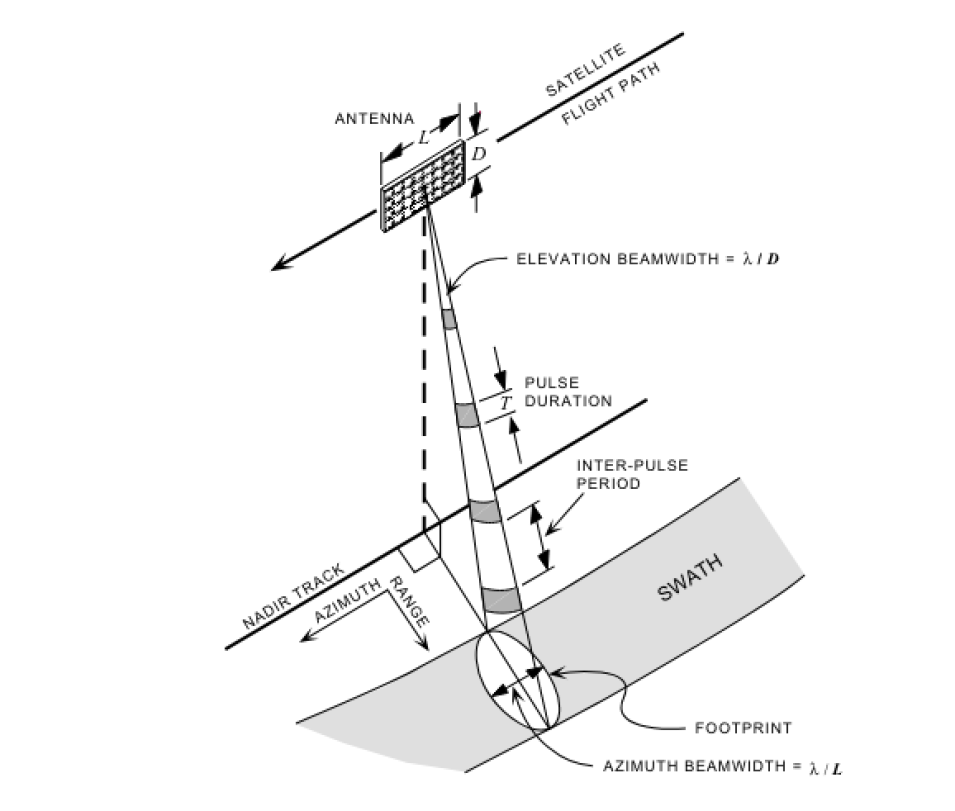
The instrument measures the distance between the sensor and the point on Earth’s surface where the signal is backscattered. This distance is the slant range, which can be projected on the ground representing the ground range. 

The flight direction is also referred to as the along-track or azimuth direction, and the direction perpendicular to the flight path is the across-track or range direction. 

The angle between the direction the antenna is pointing and the nadir is the look angle. The angle between the radar beam center and the normal to the local topography is the incidence angle. Both angles are sometimes used synonymously, which is only valid if the SAR geometry is simplified to neglect Earth’s curvature and local topography. Because the look angle of the sensor significantly affects the behavior of the backscatter, it is one of the main parameters determining the viewing geometry and the incidence angle of the backscattered signal. Depending on the characteristics of the illuminated terrain, areas of layover and shadow may occur in SAR imagery.

Image of satellite with lines indicating various SAR imagery criteria
Image Caption

Scanning configuration for a left looking SAR with a rectangular antenna. Credit: Coert Olmsted, Scientific SAR User's Guide. Alaska SAR Facility, 1993.

The Roles of Frequency and Wavelength

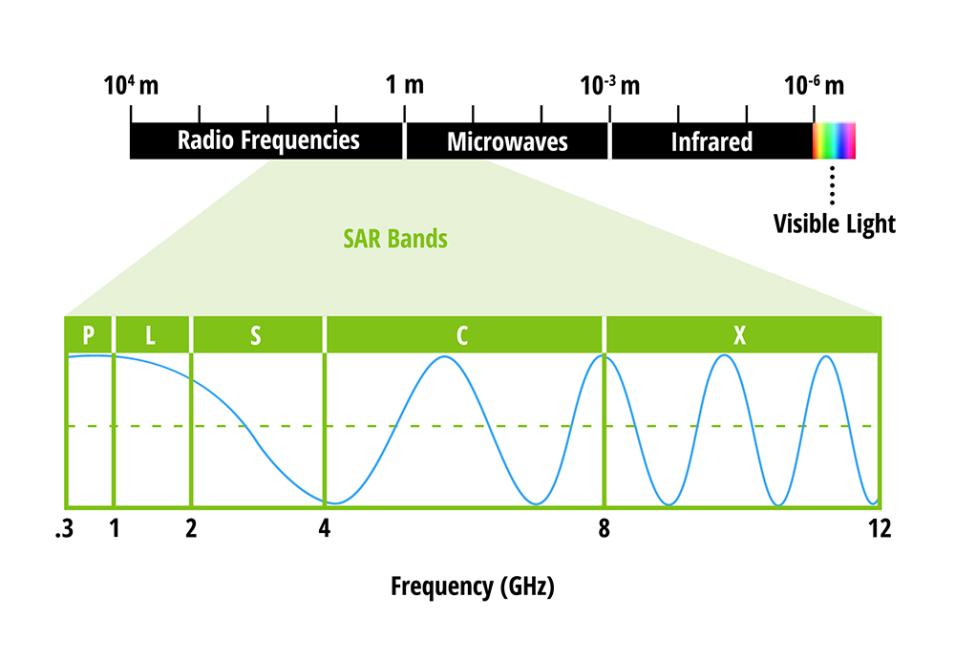
Optical instruments such as Landsat's Operational Land Imager (OLI) and Sentinel-2's Multispectral Instrument (MSI) collect data in the visible, near-infrared, and short-wave infrared portions of the electromagnetic spectrum. Radar instruments utilize longer wavelengths at the centimeter to meter scale, which enables them to create imagery of landforms that might be covered with clouds or under a dense canopy of trees. The different wavelengths of SAR are often referred to as bands, with letter designations such as X, C, L, and P.

The electromagnetic spectrum with microwave bands inset.
Image Caption

The electromagnetic spectrum with SAR bands highlighted.

The table below notes SAR bands with their associated frequency and wavelength along with typical applications for that band.

BandFrequencyWavelengthTypical Application
Ka27–40 GHz1.1–0.8 cmRarely used
K18–27 GHz1.7–1.1 cmRarely used
Ku12–18 GHz2.4–1.7 cmRarely used
X8–12 GHz3.8–2.4 cmHigh resolution SAR (urban monitoring,; ice and snow, little penetration into vegetation cover; fast coherence decay in vegetated areas)
C4–8 GHz7.5–3.8 cmSAR Workhorse (global mapping, change detection, monitoring of areas with low to moderate penetration, higher coherence); ice, ocean, maritime navigation
S2–4 GHz15–7.5 cmIncreasing use for SAR-based Earth observation and agriculture monitoring (NISAR will carry an S-band channel; expends C-band applications to higher vegetation density)
L1–2 GHz30–15 cmMedium resolution SAR (geophysical monitoring, biomass and vegetation mapping, high penetration, interferometric SAR [InSAR])
P0.3–1 GHz100–30 cmBiomass, vegetation mapping, and assessment. Experimental SAR band.

Wavelength is an important feature to consider when working with SAR, as it determines how the radar signal interacts with the surface and how far a signal can penetrate into a medium. For example, an X-band radar, which operates at a wavelength of about 3 cm, has very little capability to penetrate into broadleaf forest and mostly interacts with leaves at the top of the tree canopy. An L-band signal, on the other hand, has a wavelength of about 23 cm, which enables it to penetrate more deeply through a tree canopy and allows for more interaction between the radar signal and large branches and tree trunks. 

Wavelength doesn't just impact the penetration depth into forests, but also into other land cover types such as soil and ice. For example, scientists and archaeologists are using SAR data to help uncover lost cities and urban-type infrastructures hidden over time by dense vegetation or desert sands. For information on the use of SAR in space archaeology, view NASA Earth Observatory's Peering through the Sands of Time and Secrets Beneath the Sand.

Polarization and Scattering Mechanisms

Polarization refers to the orientation of the plane in which a transmitted electromagnetic wave oscillates. Radar can collect signals in different polarizations by controlling the analyzed polarization in both the transmit and receive paths.  While the orientation can occur at any angle, SAR sensors typically transmit linearly polarized. The horizontal polarization is indicated by the letter H, and the vertical polarization is indicated by the letter V.

The advantage of radar sensors is that signal polarization can be precisely controlled on both transmit and receive. Signals emitted in vertical (V) and received in horizontal (H) polarization would be indicated VH. Alternatively, a signal that was emitted in horizontal (H) and received in horizontal (H) would be indicated HH, and so on. Examining the signal strength from these different polarizations carries information about the structure of the imaged surface based on the following types of scattering: rough surface, volume, and double bounce.

  • Rough surface scattering, such as that caused by bare soil or water, is most sensitive to VV scattering
  • Volume scattering caused by the leaves and branches in a forest canopy is most sensitive to cross-polarized data like VH or HV
  • Double bounce scattering is caused by buildings, tree trunks, or inundated vegetation and is most sensitive to an HH polarized signal
SARPolarization
Image Caption

Strong scattering in HH indicates a predominance of double-bounce scattering (e.g., stemmy vegetation, human-created structures), while strong VV relates to rough surface scattering (e.g., bare ground, water); spatial variations in dual polarization indicate the distribution of volume scatterers (e.g., vegetation and high-penetration soil types such as sand or other dry porous soils). Credit: NASA SAR Handbook.

It is important to note that the amount of signal attributed to different scattering types may change as a function of wavelength since changes in wavelength result in changes to the penetration depth of the emitted signal. For example, a C-band signal penetrates only into the top layers of the canopy of a forest, and therefore will experience mostly roughness scattering mixed with a limited amount of volume scattering. However an L-band or a P-band signal will have much deeper penetration and will experience strongly enhanced volume scattering as well as increasing amounts of double-bounce scattering caused by objects like tree trunks.

Sensitivity of SAR measurements to forest structure and penetration into the canopy at different wavelengths used for airborne or spaceborne remote sensing observations of the land surface.
Image Caption

Sensitivity of SAR measurements to forest structure and penetration into the canopy at different wavelengths used for airborne or spaceborne remote sensing observations of the land surface. Credit: NASA SAR Handbook.

Resolution and Speckle

The spatial resolution of the radar defines the minimum separation between the measurements the instrument is able to discriminate and determines the amount of speckle introduced into the system. Speckle is a scattering phenomenon that arises because the spatial resolution of the instrument is not sufficient to resolve individual scatterers. Speckle can be reproduced if the acquisition conditions are identical, while noise is random in nature. Speckle is removed by multi-looking. The higher the spatial resolution of the radar, the more objects on the ground can be discriminated. The term spatial resolution is often confused with pixel size, which is the spacing of the pixels in the azimuth and ground range direction after processing the data.

Interferometry

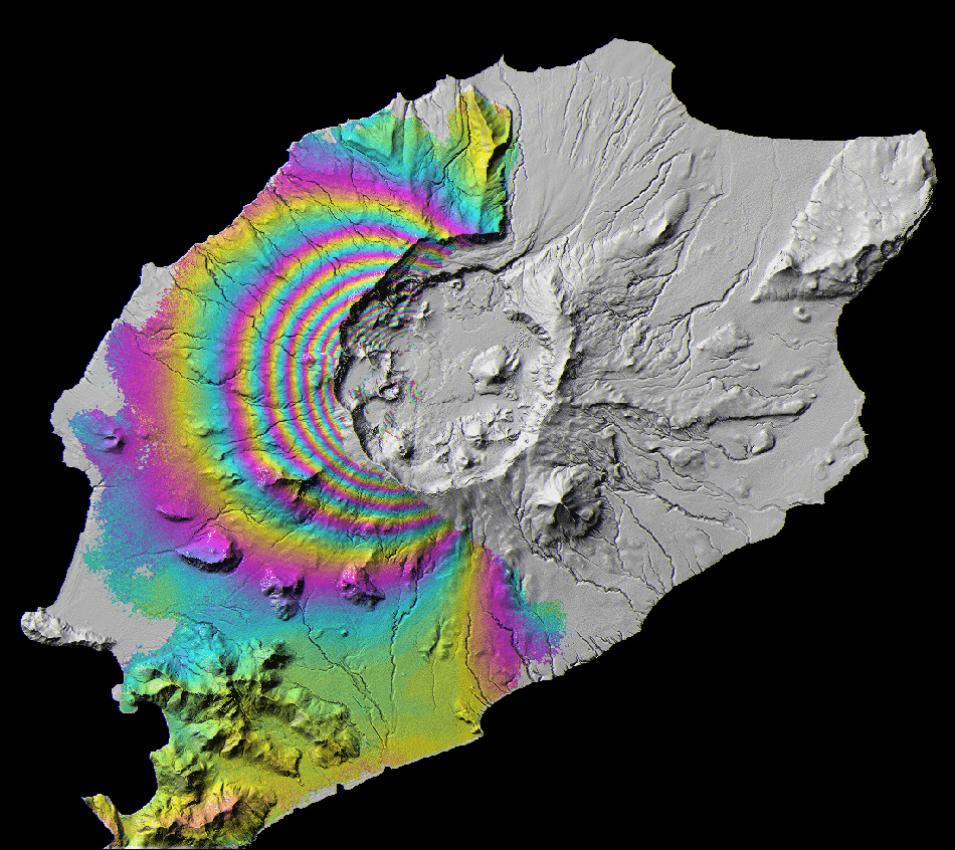
SAR data enable an analysis method called interferometry. When used with SAR, this analysis method is called interferometric SAR, or InSAR. InSAR uses the phase information recorded by the instrument to measure the distance from the instrument to the target. When at least two observations of the same target are made at different times, the distance, with additional geometric information from the instrument, can be used to measure changes in land surface topography. These measurements are very accurate (up to the centimeter level) and can be used to identify areas of deformation following events like volcanic eruptions and earthquakes.

Surface deformation on Okmok, a volcano in the Aleutian Islands, is revealed in this interferometric SAR (InSAR) ERS-2 image. Each color cycle represents 2.8 cm of ground surface movement
Image Caption

Surface deformation on Okmok, a volcano in the Aleutian Islands, is revealed in this interferometric SAR (InSAR) ERS-2 image. Each color cycle represents 2.8 cm of ground surface movement. Credit: NASA’s Alaska Satellite Facility Distributed Active Archive Center (ASF DAAC)

Data Availability

The table below lists the SAR instruments that have or currently are producing data, as well as the data parameters.

SoftwareDeveloperAnalysis TypeApplicable Platforms
Sentinel Application Platform (SNAP) Sentinel 1 Toolbox 
(S1TBX)
ESA (European Space Agency)A graphical user interface (GUI) used for both polarimetric and interferometric processing of SAR data. Start to finish processing includes algorithms for calibration, speckle filtering, coregistration, orthorectification, mosaicking, and data conversion.
  • Sentinel-1
  • ERS-1 and 2
  • ENVISAT
  • ALOS PALSAR
  • TerraSAR-X
  • COSMO-SkyMed
  • RADARSAT-2
pyroSARJohn Truckenbrodt, Friedrich-Schiller-University Jena / Deutsches Zentrum

German Aerospace Center
A Python framework for large-scale SAR satellite data processing that can access GAMMA and SNAP processing capabilities. Specializes in the handling of acquisition metadata, formatting of preprocessed data for further analysis, and options for exporting data to Data Cube.Sentinel and various past and present satellite platforms
Generic Mapping Tools Synthetic Aperture Radar 
(GMTSAR)
ConocoPhillips, Scripps Institution of Oceanography, and San Diego State UniversityGMTSAR adds interferometric processing capabilities to Generic Mapping Tools (GMT), command line tools used to manipulate geographic data and create maps. GMTSAR includes two main processors: 1. an InSAR processor that can focus and align stacks of images, maps topography into phase, conducts phase unwrapping, and forms complex interferograms, and 2. a postprocessor to filter the interferogram and create coherence, phase gradient, and line-of-sight displacement products.
  • ERS-1/2
  • Envisat
  • ALOS-1
  • TerraSAR-X
  • COSMOS-SkyMed
  • Radarsat-2
  • Sentinel-1
  • ALOS-2
Delft object-oriented radar interferometric software 
(DORIS)
 
Delft University of TechnologyInterferometric processing from single look complex (SLC) to complex interferogram and coherence map. Includes geocoding capability, but does not include phase unwrapping.Single Look Complex data from ERS, ENVISAT, JERS, RADARSAT
Statistical-Cost, Network-Flow Algorithm for Phase Unwrapping 
(SNAPHU)
Stanford Radar Interferometry Research GroupSoftware written in C that runs on most Unix/Linux platforms. Used for phase unwrapping (an interferometric process). The SNAPHU algorithm has been incorporated into other SAR processing software, including ISCE.Input data is interferogram formatted as a raster, with single-precision (float, real*4, or complex*8) floating-point data types
Hybrid Pluggable Processing Pipeline 
(HyP3)
Alaska Satellite FacilityOnline interface for InSAR processing, including steps such as phase unwrapping (using the Minimum Cost Flow algorithm). Includes access to some GAMMA and ISCE processing capabilities for interferometry. Also includes Radiometric Terrain Correction (RTC) and change detection tools.Dependent on process
InSAR Scientific Computing Environment 
(ISCE)
NASA's Jet Propulsion Laboratory and Stanford UniversityInterferometric processing packaged as Python modules. Interferometric processing from raw or SLC to complex interferogram and coherence map. Includes geocoding, phase unwrapping, filtering, and more.
  • ALOS
  • ALOS2
  • COSMO_SKYMED
  • ENVISAT
  • ERS
  • KOMPSAT5
  • RADARSAT1
  • RADARSAT2
  • RISAT1
  • Sentinel-1
  • TERRASARX
  • UAVSAR
MapReadyAlaska Satellite FacilityA GUI used to terrain-correct, geocode, and apply polarimetric decompositions to multi-polarimetric SAR (PolSAR) data.ALOS Palsar and other older datasets in ASF’s catalog (SNAP S1TBX recommended for Sentinel-1 datasets)
Python Radar Analysis Tools 
(PyRat)
Andreas ReigberA GUI implemented in Python for post-processing of both airborne and space-based SAR imagery. Includes various filters, geometrical transformations and capabilities for both interferometric and polarimetric processing.Airborne and space-based SAR data
Polarimetric SAR data Processing and Education Toolbox
(PolSARpro)
ESAA GUI for high-level polarimetric processing. Includes analysis capabilities for PolSAR, PolinSAR, PolTomoSAR, and PolTimeSAR data, including functionalities such as elliptical polarimetric basis transformations, speckle filters, decompositions, parameter estimation, and classification/segmentation. Includes a fully polarimetric coherent SAR scattering and imaging simulator for forest and ground surfaces.
  • ALOS-1 / PALSAR-1
  • ALOS-2 / PALSAR-2
  • COSMO-SKYMED
  • GaoFen-3
  • RADARSAT-2
  • RISAT
  • TerraSAR X
  • Tandem-X
  • SENTINEL-1A and -1B

Supports upcoming missions:

  • ALOS-4 / PALSAR-3
  • BIOMASS
  • SAOCOM
  • NISAR
  • NOVASAR-S
  • RCM / RADARSAT-3
  • TerraSAR-L

Several new sensors are also planned for launch in the next few years. These include the joint NASA/ISRO (Indian Space Research Organization) SAR (NISAR) platform, which will collect L-band and S-band SAR data. All data will be free and openly available to the public. ESA is also launching the P-band BIOMASS mission, which will have an open data policy. All free and publicly available SAR data can be accessed in Earthdata Search.

Data Processing and Analysis

One of the limitations of working with SAR data has been the somewhat tedious preprocessing steps that lower-level SAR data require. Depending on the type of analysis you want to do, these preprocessing steps can include: applying the orbit file, radiometric calibration, de-bursting, multilooking, speckle filtering, and terrain correction. These steps are described in more detail in this SAR Pre-Processing one pager.

More recently, data repositories like NASA's Alaska Satellite Facility Distributed Active Archive Center (ASF DAAC) are starting to provide radiometrically terrain-corrected products for select areas, reducing the amount of time and effort the user has to put into preprocessing on their own.

Resources

Much of the information for this page is drawn from The SAR Handbook: Comprehensive Methodologies for Forest Monitoring and Biomass Estimation. In particular, the following chapters provide good introductory material:

  • Meyer, Franz. "Spaceborne Synthetic Aperture Radar – Principles, Data Access, and Basic Processing Techniques." SAR Handbook: Comprehensive Methodologies for Forest Monitoring and Biomass Estimation. Eds. Flores, A., Herndon, K., Thapa, R., Cherrington, E. NASA. 2019. doi:10.25966/ez4f-mg98
  • Kellndorfer, Josef. "Using SAR Data for Mapping Deforestation and Forest Degradation." SAR Handbook: Comprehensive Methodologies for Forest Monitoring and Biomass Estimation. Eds. Flores, A., Herndon, K., Thapa, R., Cherrington, E. NASA. 2019. doi:10.25966/68c9-gw82
  • Saatchi, Sassan. "SAR Methods for Mapping and Monitoring Forest Biomass." SAR Handbook: Comprehensive Methodologies for Forest Monitoring and Biomass Estimation. Eds. Flores, A., Herndon, K., Thapa, R., Cherrington, E. NASA. 2019. doi:10.25966/hbm1-ej07

Olmstead, C. 1993. SAR User's Guide. Alaska SAR Facility. ASF-SD-003. PDF.

Jackson, C.R., Apel, J.R. 2004. Synthetic Aperture Radar Marine User's Manual. NOAA Office of Research and Applications.

Principles of SAR (NOAA). PDF

A Mathematical Tutorial on Synthetic Aperture Radar. PDF

Other Helpful Resources

NASA Applied Remote Sensing Training (ARSET) Program:

ESA EO College: Echoes in Space: Introduction into the Principles and Applications of Radar Remote Sensing

University of Alaska Fairbanks: Microwave Remote Sensing

PCI Geomatics Live Stream: Advanced SAR Training Course (video)

ISRO (Indian Space Research Organization): SAR Data Processing Shri Shashi Kumar 19 Sep 2016 (video)