Stormy Vineyards

New methods help Argentinian farmers brace for bad weather.

Eleven-year old Kristen Rasmussen and her classmates watched from under their desks as a tornado churned past their classroom window. She marveled at the terrifying beauty of the tornado as it whirled over her school playground in Boulder, Colorado. Today, Rasmussen studies intense storm systems all over the globe, tracking weather as unpredictable and intense as the twister she saw as a kid.

Rasmussen, now a postdoctoral research scientist at the National Center for Atmospheric Research (NCAR), has her sights on storms in subtropical South America, most of which is in Argentina. The storms there are “untamed, intense, and vigorous,” much like Argentine wine.

Though wine buffs might recognize that tagline for Malbec World Day, a celebration of Argentina’s flagship wine, scientists have discovered that storms from the region bear the same characteristics. It turns out Argentina has the perfect terroir that gives both its grapes and storms their distinctive character. But unlike Argentine grapes, little is known about their storms.

With satellite rainfall data and a little creative detective work, Rasmussen and her colleagues are tracking these mysterious storm systems, years after they have dissipated, to ultimately discover how they formed. What they learn could be a boon to science, and to the economies that depend on the fruit of the vine.

image
Image Caption

Ripe malbec grapes hang from the vine in Mendoza Province, Argentina. (Courtesy I. Lumb)

Location, location, location

Subtropical South America brews massive storm clusters, called mesoscale convective systems, that are 60 percent larger than those in the United States. They are collections of thunderstorms that reach across the horizon for hundreds of miles and can persist for more than twelve hours. The floods, tornadoes, and hail they unleash can decimate crops. “It’s an economic security problem for Argentina,” Rasmussen said. “I’ve seen reports of wineries losing one hundred percent of their crops for a year because of one hail storm.”

One area that gets a lot of hail is Mendoza. A province in the foothills of central-west Argentina, Mendoza is home to most of Argentina’s vineyards, and produces most of South America’s wine. Cabernet sauvignon, chardonnay, and malbec grapes thrive in this high-altitude desert region.

Like other regions in the Andes foothills, Mendoza’s geography plays a big role in breeding intense systems that can dump much of a region’s annual precipitation all at once, sometimes in the form of grapefruit-sized hail. The Andes funnel warm, moist air from the Amazon down into Argentina’s subtropical arid environment. This provides the convection—rapidly rising warm air mixed with moisture—that fuels severe weather. Rasmussen and her colleagues are among the first to document the mesoscale convective systems in South America. They needed to find out exactly where these systems are happening, and when.

weather_lightning
Image Caption

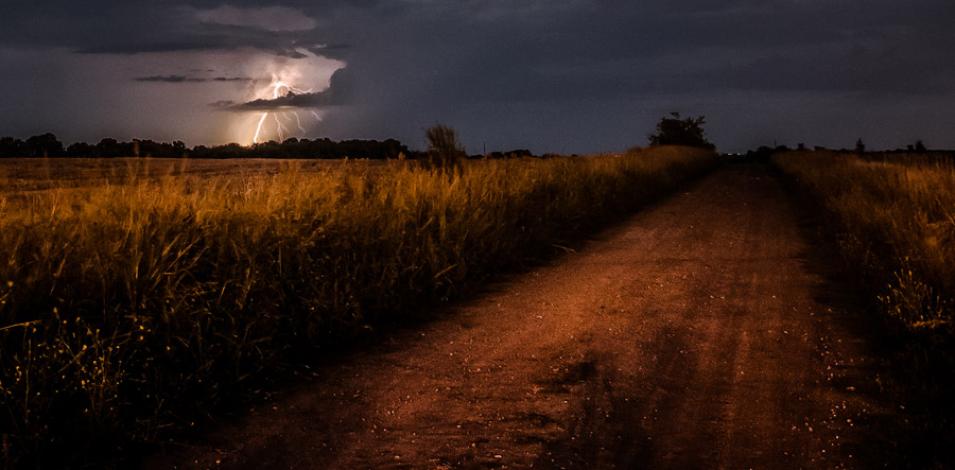
A summer thunderstorm flashes lightning over Entre Rios, Argentina. (Courtesy E. Küffer/Flickr, cropped from original)

Like an MRI from space

The team became intrigued when radar imagery from the Tropical Rainfall Measuring Mission (TRMM) satellite revealed that this part of Earth is home to both the most frequent large hail in the world and the deepest convective storms. “This region is really special,” Rasmussen said. “And because of NASA measurements, we’ve been able to identify it.”

Manuel Zuluaga, a research scientist at the Universidad Nacional de Colombia, said, “We wanted to try to know why, but the first step on the list was to locate the storms.” To pinpoint locations, the researchers meticulously tracked the systems, snapshot by snapshot, using sixteen years of TRMM data from NASA's Goddard Earth Sciences Data and Information Services Center (GES DISC). Electromagnetic echoes that had bounced between the radar instrument and the rain and ice droplets gave shape to the storms. Rasmussen said, “It’s like an MRI. It scans the internal pieces and gives us crucial information for understanding the character of the storms.” The process helped identify three major types of severe storms within a mesoscale system.

These three types, called deep core, wide core, and broad stratiform, coincide with the phases of a system. Zuluaga explained, “Imagine a big storm with a lot of lightning and wind. The air starts rising, making big, deep plumes that go up in the atmosphere. That’s what we call deep core. Next, the cells become bigger and shallower, and they become wide cores. Later, when everything is dying out, they become broad stratiform, where the rainfall is light, but widespread.” Severe weather follows, cycling from hail near foothills in places like Mendoza to flooding and tornadoes on the La Plata Basin, Argentina’s central plains.

Taking things a step further, they looked at average monthly lightning rates. Lightning strikes near severe storms, so information on its whereabouts could corroborate what the radar data showed. Merged data from the TRMM Lightning Imaging Sensor (LIS) and the Optical Transient Detector on Microlab-1, archived at NASA's Global Hydrology Resource Center (GHRC) Distributed Active Archive Center (DAAC), confirmed the locations of the storms. Rasmussen said, “We identified Mendoza as having large amounts of severe episodes of hail. There’s also this strong lightning bull’s eye right over it.”

image
Image Caption

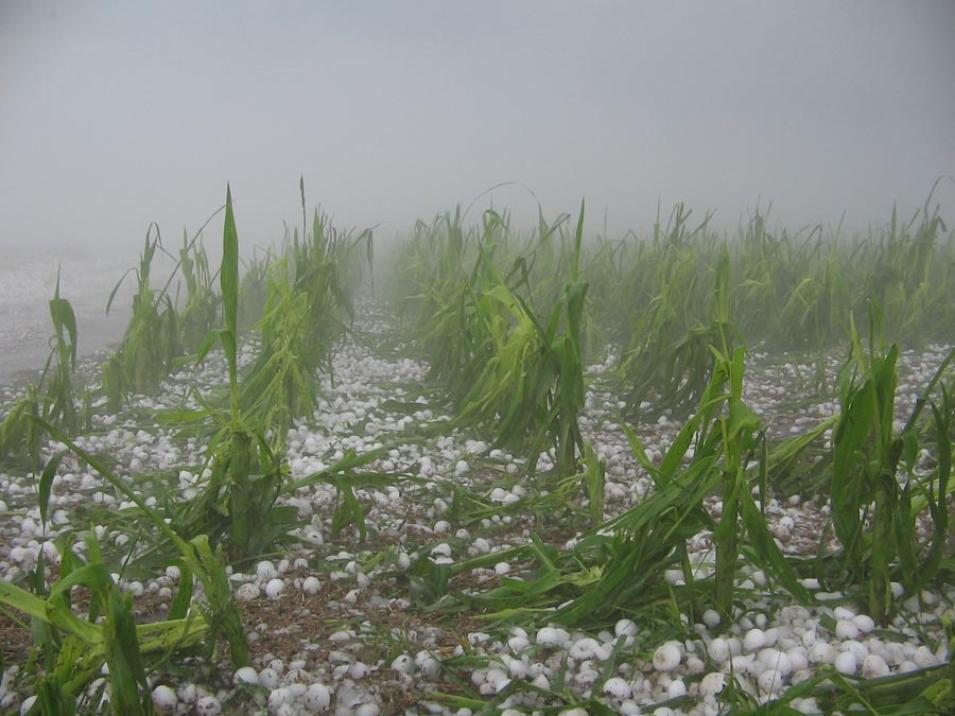
A cornfield in Argentina is destroyed by a hail storm on November 15, 2006. Storm systems are especially severe in subtropical South America, and regularly threaten agriculture. (Courtesy M. Ramello/Flickr)

Ground reporting

With the search narrowed, Rasmussen devised a way to close in further. They needed a map that validated where the three types of storms struck land. This is typically created using in situ measurements, such as meteorological ground stations. But South America has few of these. She realized local newspapers could show major storm events.

Scouring newspaper databases for articles on hail, flooding, and tornadoes, the team gathered the top 100 cases that matched the three storm types near the time the TRMM satellite passed overhead. Roads and landmarks mentioned in the articles helped them locate the storms on a map.

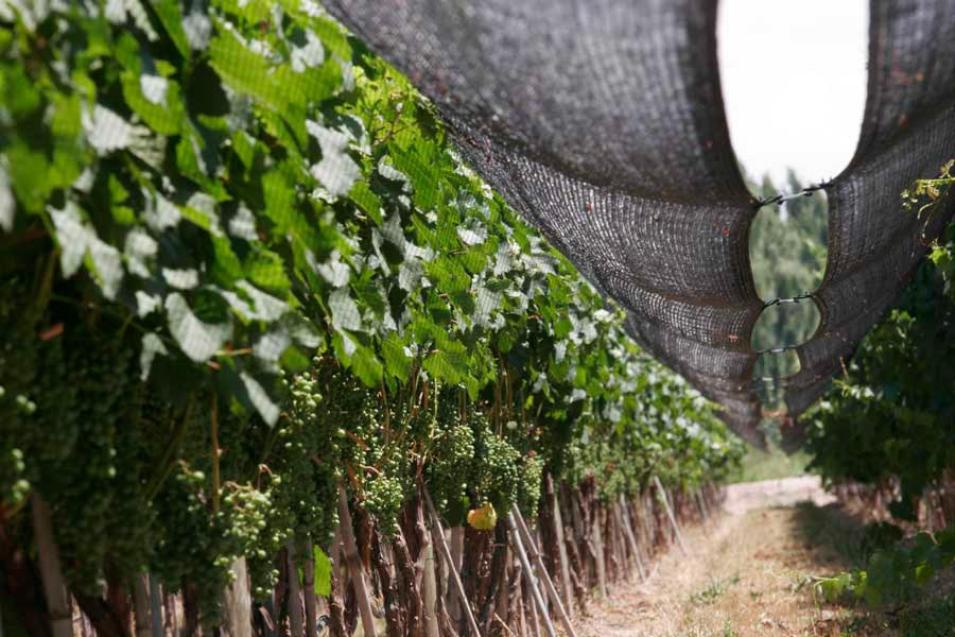
With the lightning record and a map of storm reports, they created the first detailed profile of the storm conditions in the area. “Now that we have a map of where they happen, we can relate that to what we know about the physics of the atmosphere to learn the causes,” Zuluaga said. This helps them improve forecasting models, which will help predict dangerous weather. In an interview with Rasmussen, a spokesperson from the Bodega Norton winery in Mendoza said that installing nets to protect against hail is very expensive, almost $10,000 per hectare, so some producers cannot afford them. The government uses a program of cloud seeding to destroy the hail, but it is done only east of Mendoza. Better forecasting of the storms that hit all regions could help the Argentine government target them more effectively in the future.

image
Image Caption

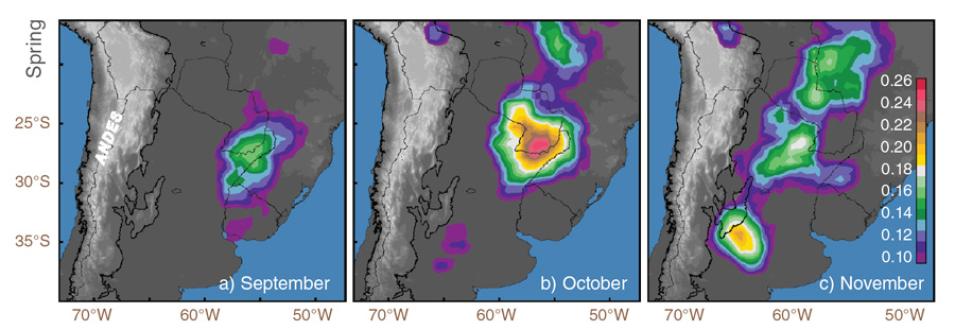
These maps show the average monthly rate of lightning flashes per square kilometer per year in springtime from 1998 to 2013. Red and pink indicate the highest average rate of monthly flashes; purple and magenta the lowest. Thick black lines mark the 0.5 kilometer topography contour on the Andean foothills, where convection initiates severe storms. Data are from the Tropical Rainfall Measuring Mission (TRMM) Lightning Imaging Sensor (LIS) from September through November in subtropical South America. (Courtesy K. L. Rasmussen)

How a storm grows

In the meantime, improvements in satellite instruments will help Rasmussen and her colleagues collect more nuanced information. TRMM was decommissioned in June 2015, but the Global Precipitation Measurement (GPM) satellite is now orbiting Earth in its place. Zuluaga said that GPM’s ability to sense dual wavelengths allows them to study mid-latitudes and see more ice in clouds than before.

Another crucial piece for the team is ground measurements. “We need to profile the atmosphere to understand more about how these systems form,” Rasmussen said. “A satellite-based radar gives us snapshots, so we only capture certain times in their life cycle. What we’d really like to do is observe these systems from beginning to end and understand how they grow.”

A ground-based radar called S-Band Dual-Polarization Doppler Radar (S-Pol) that can scan the atmosphere continuously will help them do just that. The team is busy planning a field campaign with the Argentinian Meteorological Service (Servicio Meteorológico Nacional/SMN) and researchers at the University of Buenos Aires to begin using S-Pol.

Along with instruments on the ground, humans are helpful, too. In the United States, storm spotters trained by the National Weather Service (NWS) and other agencies regularly report hail sizes or tornadoes. It will take time to train citizen scientists in Argentina, and to develop a national system for archiving their observations.

Yet Rasmussen is optimistic. “There are a lot of people that live in this region,” she said. “They don’t yet have the capability to look at these storms with their own networks, but we are able to provide information that could help save human life and property. We could warn vintners they might have a flood, or notify people when there’s a severe storm on its way. To have a direct application that people will use is exciting and it’s why we do this type of research.”

image
Image Caption

In addition to protection from hail, black nets like this one at the Dominio del Plata winery in Mendoza absorb more of the sun’s heat than a white net, which can help the grapes ripen. (Courtesy Vine Connections/Dominio del Plata Winery)

References

Cecil, D. J., D. Buechler, and R. Blakeslee. 2014. LIS/OTD 0.5 Degree High Resolution Monthly Climatology (HRMC) Data. Available online from the NASA EOSDIS Global Hydrology Resource Center (GHRC) Distributed Active Archive Center (DAAC). Huntsville, AL, USA. doi:10.5067/LIS/LIS-OTD/DATA303.

Christian, H., S. Goodman, and R. Blakeslee. 2014. NASA Marshall Space Flight Center (MSFC) Lightning Imaging Sensor (LIS) Science Data. Available online from the NASA EOSDIS Global Hydrology Resource Center (GHRC) Distributed Active Archive Center (DAAC). Huntsville, AL, USA. https://ghrc.nsstc.nasa.gov/uso/ds_docs/lis/lis_dataset.html.

Houze, R. A., Jr. 2004. Mesoscale convective systems. Reviews of Geophysics 42, doi:10.1029/2004RG000150.

NASA Goddard Earth Sciences Data and Information Services Center (GES DISC). 2014. TRMM 2A-23 and TRMM 2A-25 products. Greenbelt, MD, USA.

Rasmussen, K. L., M. D. Zuluaga, and R. A. Houze Jr. 2014. Severe convection and lightning in subtropical South America. Geophysical Research Letters 41: 7,359–7,366, doi:10.1002/2014GL061767.

For more information

NASA Global Hydrology Resource Center Distributed Active Archive Center (GHRC DAAC)

NASA Goddard Earth Sciences Data and Information Services Center (GES DISC)

About the remote sensing data
Satellites Tropical Rainfall Measuring Mission (TRMM) TRMM
Sensors

TRMM Precipitation Radar (PR) TRMM Lightning Imaging Sensor (LIS)

Optical Transient Detector (OTD)
Data sets TRMM PR V7 2A25 data LIS/OTD HRMC from TRMM LIS and Microlab-1 OTD TRMM LIS Orbital Science Data
Resolution 4-5 kilometer horizontal, 250 meter vertical resolution at nadir 0.5 degree
Parameters Radar reflectivity and rain type Lightning rates Lightning flashes and sensor viewing time Raw flash count
DAACs NASA Goddard Earth Sciences Data and Information Services Center (GES DISC) NASA Global Hydrology Resource Center Distributed Active Archive Center (GHRC DAAC)

Details

Last Updated

Published

Data Center/Project

Goddard Earth Sciences Data and Information Services Center (GES DISC)
Global Hydrometeorology Resource Center DAAC (GHRC DAAC)