Earth Science Data Roundup: February 2024

A summary of datasets, products, and resources released by NASA’s Distributed Active Archive Centers (DAACs) in January 2024.

Atmospheric Science Data Center (ASDC)

ACCLIP Data Now Available

NASA's ASDC released data from the Asian Summer Monsoon Chemical and CLimate Impact Project (ACCLIP), an international, multiorganizational suborbital campaign conducted July 15, 2022, to August 31, 2022, and designed to study the aerosols and chemical transport associated with the Asian Summer Monsoon (ASM) in the Western Pacific region.

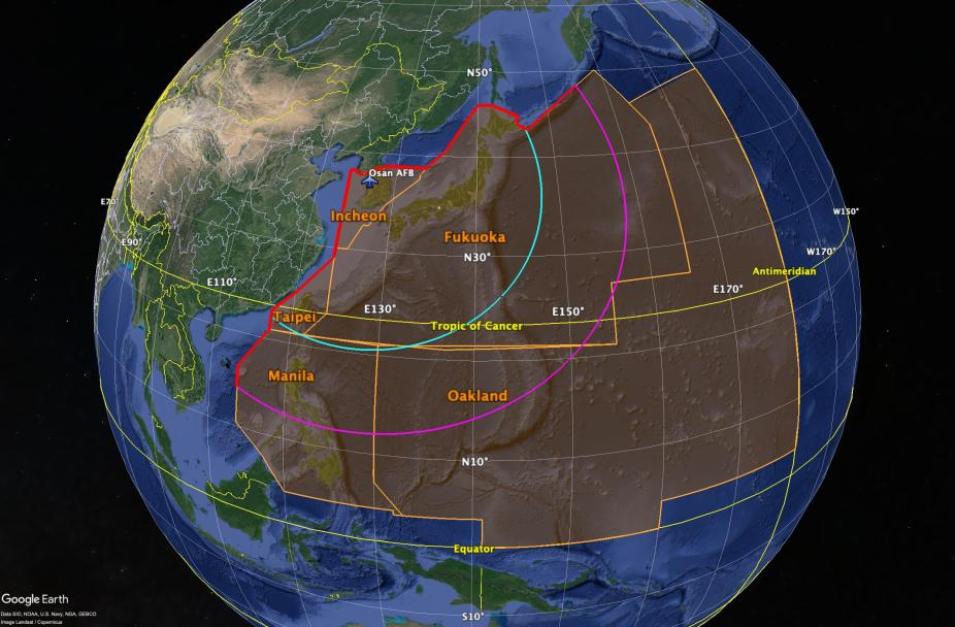
A globe with the ACCLIP study regions and flight maps
Image Caption

Map of the ACCLIP mission showing the five flight information regions (Incheon, Fukuoka, Oakland Oceanic, Manila, and Taipei) and the flight ranges (purple and cyan lines) of the project's aircraft. Credit: NASA/ACCLIP.

The ASM is the largest meteorological pattern in the Northern Hemisphere during the summer and is associated with persistent convection and large anticyclonic flow patterns in the upper troposphere and lower stratosphere. ACCLIP was conducted by NASA and the National Center for Atmospheric Research (NCAR) with the primary goal of investigating the impacts of Asian gas and aerosol emissions on global chemistry and climate.

Data access and more information about the ACCLIP data release

ACTIVATE Data Workshop Materials Available

The Aerosol Cloud meTeorology Interactions oVer the western ATlantic Experiment (ACTIVATE) team hosted an open data workshop during its annual science team meeting in November 2023. The workshop featured an overview of the ACTIVATE mission and its data, science talks given by ACTIVATE team members, and interactive hands-on sessions for in-person participants.

ACTIVATE Workshop materials

New Merge Service for ASDC's Sub-Orbital Order Tool Released

ASDC released a new merge service as part of the Sub-Orbital Order Tool (SOOT). This new service allows users to align data to a common time base for easier comparison between files. Currently, the merge service is available for ICARTT formatted files from the same campaign, flight day, launch, and platform. Users can customize their merge options to include or omit specific variables, choose the time base of the merge, and select information to include in the data output (e.g., standard deviation, averages). To learn more about SOOT, see our recent Data Tool in Focus article.

More information about the new SOOT service

Global Hydrometeorology Resource Center Distributed Active Archive Center (GHRC DAAC)

IMPACTS Campaign Dataset Released

NASA's GHRC DAAC released the SBU Pluvio Precipitation Gauge datasets from the Investigation of Microphysics and Precipitation for Atlantic Coast-Threatening Snowstorms (IMPACTS) campaign, which is the first comprehensive study of East Coast snowstorms in 30 years. The SBU Pluvio Precipitation Gauge dataset consists of precipitation intensity and precipitation accumulation collected using the OTT Pluvio2 weighing rain gauge. Data files are available in ASCII-CSV format and cover the time period from January 7, 2020, through March 2, 2023.

Data acces for the SBU Pluvio Precipitation dataset and more information about this precipitation dataset

Goddard Earth Sciences Data and Information Services Center (GES DISC)

GES DISC Level 3 and 4 Regridder and Subsetter Service Adds Support for FLDAS2 Central Asia Product

The Level 3/4 Subsetting Service at NASA’s GES DISC has added support for the FLDAS2 Noah-MP GDAS Land Surface Model L4 Central Asia Daily 0.01 x 0.01 degree product. The dataset contains 27 variables on a 0.01° x 0.01° grid covering the Central Asia model domain. Data are produced daily at a one-day latency and are available from October 1, 2000, to the present.

A data visualization showing evapotranspiration over Central Asia in 2020.
Image Caption

This visualization of data from the FLDAS2 Noah-MP GDAS Land Surface Model L4 Central Asia Daily 0.01 x 0.01 product shows total evapotranspiration over Central Asia for August 1, 2020. Darker colors indicate areas of greater evapotranspiration. Credit: NASA's GES DISC.

The GES DISC Level 3 and 4 Regridder and Subsetter tool allows for spatial, temporal, and variable subsetting, as well as the re-gridding of data to various other grids through several interpolation methods. FLDAS is the Famine Early Warning Systems Network (FEWS NET) Land Data Assimilation System. The goal of FLDAS is to use observational datasets and advanced modeling and data assimilation methods to generate high quality fields of land surface states and fluxes used for FEWS NET decision support.

More information about the new FLDAS2 Noah-MP GDAS Land Surface Model L4 support

Global Precipitation Measurement "10-in-10" Webinar Series

NASA’s Global Precipitation Measurement (GPM) mission has entered its tenth year of operation! In celebration of this milestone, learners of all ages are invited to join the free and informative webinars the mission will hold on the third Thursday of each month, February through November 2024, at 8 p.m. (ET).

Learn more about the GPM mission webinar series

TROPESS Chemistry Reanalysis Version 2 (TCR-2) Products Released

A data visualization showing nitrogenoxide emissions over the globe from 2005 to 2018.
Image Caption

TRC-2 global distributions of surface NOx emissions averaged over 2005 to 2018. Orange and red colors indicate areas of higher NOx emissions. Purple and blue indicate lower concentrations. Credit: NASA JPL SSW.

GES DISC released TRopospheric Ozone and Precursors from Earth System Sounding (TROPESS) Chemistry Reanalysis Version 2 (TCR-2) datasets for trace gasses of ozone (O3), carbon monoxide (CO), hydroxide (OH), sulfur dioxide (SO2), peroxyacetyl nitrate (PAN), nitric acid (HNO3), nitric oxide (NO), nitrogen dioxide (NO2), formaldehyde (CH2O), aerosols (SO4, NH4, and NO3), and emission sources of nitrogen oxide (NOx), CO, and SO2. The TCR-2 datasets feature a chemical reanalysis technique that combines observational information and provides comprehensive information on tropospheric composition variations using data assimilation from multiple satellite instruments.

The TCR-2 datasets cover January 1, 2005, to December 31, 2021, are written in netCDF4 format, and provide global coverage with 2-hourly, 6-hourly, and monthly averages at a grid resolution of 1.125º latitude x 1.125º longitude. The data are reported at a range of 27 vertical levels from the surface (1000 hPa to 60 hPa).

Data access and more information about the TCR-2 products

Land Processes DAAC (LP DAAC)

VIIRS Version 2 Water Reservoir Data Products Released

NASA's LP DAAC released the Visible Infrared Imaging Radiometer Suite (VIIRS) Version 2 Water Reservoir product suite. The VIIRS Version 2 release includes data products from both the NASA-NOAA Suomi National Polar-orbiting Partnership (Suomi NPP) satellite and the Joint Polar Satellite System (JPSS) NOAA-20 satellite. These collections will continue to grow as data are produced chronologically.

The products included in the suite are:

  • VIIRS/NPP Water Reservoir Area 8-day L3 Global V002 (VNP28C2)
  • VIIRS/NPP Water Reservoir Monthly L3 Global V002 (VNP28C3)
  • VIIRS/JPSS1 Water Reservoir Area 8-day L3 Global V002 (VJ128C2)
  • VIIRS/JPSS1 Water Reservoir Monthly L3 Global V002 (VJ128C3)

The data are hosted on NASA's Earthdata Cloud and are available for download through Earthdata Search.

Data Access and more information about the Water Reservoir Data Products

Use of Aura OMI as an Ancillary Ozone Input for ASTER Products Discontinued

As of October 6, 2023, Ozone Monitoring Instrument (OMI) data from NASA's Aura satellite will no longer be used as the ancillary ozone input for Advanced Spaceborne Thermal Emission and Reflection Radiometer (ASTER) data products.

For more information about the availability of Aura OMI data, see NASA's Earthdata Forum.

Release of AppEEARS Version 3.45—VIIRS Version 2 Products and MODIS Version 6.1 Vegetation Continuous Fields

Version 3.45 of the Application for Extracting and Exploring Analysis Ready Samples (AppEEARS) data tool is now available. This release adds the VIIRS Version 2 Surface Reflectance, Thermal Anomalies and Fires, and Leaf Area Index/FPAR product suites from the Suomi NPP and NOAA-20 satellites. This release also includes the MODIS/Terra Vegetation Continuous Fields Yearly L3 Global 250m SIN Grid V061 data product.

AppEEARS offers a simple and efficient way to perform data access and transformation processes by enabling users to download only the data they need. For more information about the tool, see the Data Tool in Focus article.

More information about VIIRS products added to AppEEARS

Level 1 and Atmosphere Archive and Distribution System DAAC (LAADS DAAC)

New VIIRS Calibrated Radiances and Geolocation Products

NASA's LAADS DAAC released the Calibrated Radiances and Geolocation Version 2.0 Product Collection produced from data acquired by the VIIRS instrument aboard the JPSS NOAA-21 satellite. The new data collection includes three products each for calibrated radiances and geolocation (each relating to image-resolution, moderate-resolution, and day-night band resolution).

The nadir door of the NOAA-21 VIIRS instrument was opened on December 5, 2022, and its cryo-radiator door was opened on February 8, 2023. The release date for the NOAA-21 VIIRS v2.0 collection data products begins February 10, 2023.

Data access and more information about the VIIRS radiances and geolocation collection

National Snow and Ice Data Center DAAC (NSIDC DAAC)
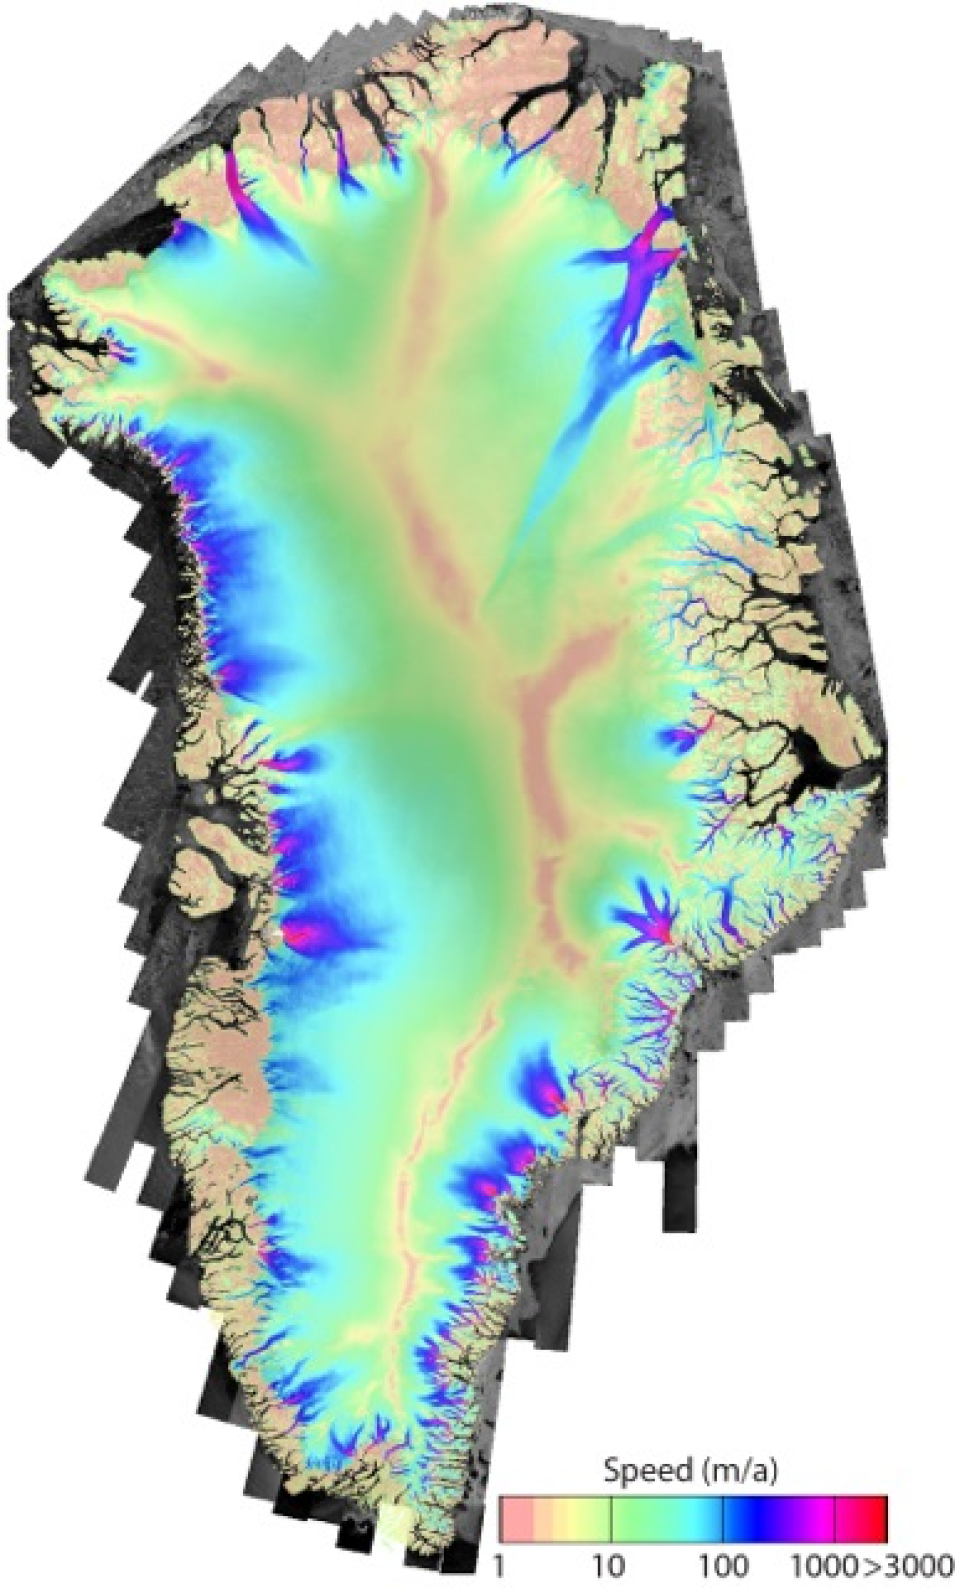
This color-coded map of Greenland shows a multiyear ice velocity mosaic for the Greenland Ice Sheet, superimposed upon topographic features along the coast. Highest velocities appear in magenta, intermediate velocities appear in blue and green, and lowest velocities appear in yellow.
Image Caption

Multiyear ice velocity mosaic for the Greenland Ice Sheet superimposed on topographic coastal features. Highest ice velocities appear in magenta, intermediate velocities appear in blue and green, and lowest velocities appear in yellow. Credit: NASA MEaSUREs Greenland Ice Mapping Project (GrIMP) using German Aerospace Center, ESA (European Space Agency), USGS, JAXA (Japan Aerospace Exploration Agency), and CSA (Canadian Space Agency) data.

Update: MEaSUREs Greenland Image Mosaics and 6 and 12 day Ice Sheet Velocity Mosaics

The NASA Making Earth System Data Records for Use in Research Environments (MEaSUREs) Program Greenland Image Mosaics from Sentinel-1A and -1B, Version 4 and MEaSUREs Greenland 6- and 12-day Ice Sheet Velocity Mosaics from Synthetic Aperture Radar (SAR), Version 2 datasets have been updated. The temporal coverage for the image mosaics has been extended until October 27, 2023, and the 6- and 12-day velocity mosaics now span until October 15, 2023.

Data access and more information about the Greenland mosaics

Update: MEaSUREs Greenland Quarterly/Monthly Ice Sheet Velocity Mosaics from SAR and Landsat, Version 5

The MEaSUREs Greenland Quarterly Ice Sheet Velocity Mosaics from SAR and Landsat, Version 5 and the MEaSUREs Greenland Monthly Ice Sheet Velocity Mosaics from SAR and Landsat, Version 5 datasets have been updated. New data have been added and both datasets now span from December 1, 2014, to August 31, 2023.

These datasets consist of quarterly (three-month interval) and monthly ice velocity mosaics for the Greenland Ice Sheet. The data are derived from SAR data acquired by the German Aerospace Center's TerraSAR-X and TanDEM-X satellites and the ESA (European Space Agency) Sentinel-1A and -1B satellites, as well as from optical imagery acquired by the NASA/USGS Landsat 8 and Landsat 9 satellites.

Access to the updated quarterly/monthly SAR and Landsat ice velocity datasets

Update: MEaSUREs Greenland Ice Velocity: Selected Glacier Site Velocity Maps from InSAR, Version 4

The MEaSUREs Greenland Ice Velocity: Selected Glacier Site Velocity Maps from InSAR, Version 4 dataset has been updated with new data from January 21, 2022, to September 20, 2023.

This dataset provides velocity estimates determined from Interferometric Synthetic Aperture Radar (InSAR) data for major glacier outlet areas in Greenland. Some of these areas have shown profound changes in velocity over the observation period of the MEaSUREs Program. The InSAR Selected Glacier Site Velocity Maps are produced from image pairs measured by the German Aerospace Center's TerraSAR-X and TanDEM-X satellites.

Access updated InSAR ice velocity maps

Multiple ATLAS/ICESat-2 Datasets Retiring

Previous versions of the multiple Advanced Topographic Laser Altimeter System (ATLAS)/Ice, Cloud, and Land Elevation Satellite-2 (ICESat-2) along-track datasets will be retired on February 26, 2024. Access to the data will no longer be available after this date (although dataset documentation will remain accessible for future reference). NSIDC DAAC recommends users transition to the latest versions of the following datasets, which have been available since August 2023:

Version-specific details can be found under "Version Summary" on each dataset's landing page.

More information about the ATLAS dataset retirement

Update: Daily Lake Ice Phenology Time Series Derived from AMSR-E and AMSR2, Version 1

The Daily Lake Ice Phenology Time Series Derived from the Advanced Microwave Scanning Radiometer for EOS (AMSR-E) and Advanced Microwave Scanning Radiometer 2 (AMSR2), Version 1 dataset, which provides 5 kilometer ice phenology retrievals that describe daily lake ice conditions (ice-on/ice-off) over the Northern Hemisphere, has been updated. The dataset now includes data from January 1, 2016, to December 31, 2022.

More information about the Daily Lake Ice Phenology Time Series dataset update

Update: Sea Ice Concentrations from Nimbus-7 SMMR and DMSP SSM/I-SSMIS Passive Microwave Data, Version 2

The Sea Ice Concentrations Passive Microwave Data dataset produced from data acquired the Nimbus-7 satellite’s Scanning Multichannel Microwave Radiometer and Defense Meteorological Satellite Program (DMSP) Special Sensor Microwave/Imager (SSM-I) / Special Sensor Microwave Imager/Sounder (SSMIS) has been updated through September 30, 2023. This dataset is generated from brightness temperature data and is designed to provide a consistent time series of sea ice concentrations spanning the coverage of several passive microwave instruments. The data are provided in the polar stereographic projection at a grid cell size of 25 x 25 kilometers.

Data access to the sea ice concentrations dataset

Oak Ridge National Laboratory DAAC (ORNL DAAC)

SHIFT: AVIRIS-NG Full-Resolution True Color Images Available

NASA's ORNL DAAC released a dataset of full-resolution 3-band (true-color) imagery from the Airborne Visible/Infrared Imaging Spectrometer-Next Generation (AVIRIS-NG) instrument as part of the Surface Biology and Geology High-Frequency Time Series (SHIFT) campaign. The SHIFT campaign, which took place from February to May 2022 (with a follow-up activity for one week in September 2022), used NASA's AVIRIS-NG instrument to collect Visible to Short Wavelength InfraRed (VSWIR) data at approximately a weekly cadence across a broad study area, enabling traceability analyses related to the science value of VSWIR revisits.

A map showing the flight patterns and study area of the SHIFT mission.
Image Caption

The SHIFT campaign uses a research plane carrying the AVIRIS-NG instrument to collect data on the function, health, and resilience of plant communities in the 640-square-mile (1,656-square-kilometer) area of Santa Barbara County, California, and the nearby ocean shown in this annotated map. Credit: NASA/JPL-Caltech.

AVIRIS-NG measures radiance at approximately 5-nanometer (nm) intervals in the VSWIR spectral range from 380-2510 nm. The images in this dataset are true color (RGB) images from the wavelengths centered at approximately 808, 658, and 563 nm, subset from the full spectrum collected by AVIRIS-NG. There are two files for each flight line, one in PNG and one in georeferenced cloud-optimized GeoTIFF (COG) format; the GeoTIFF file contains radiance floating point values while the PNG file has been scaled and converted to integers.

Data access and more information about the SHIFT dataset

ABoVE Alder Shrub Cover and Soil Properties, Alaska, 2019, Version 2 Dataset Released

The Alder Shrub Cover and Soil Properties, Alaska, 2019, Version 2 dataset from the Arctic-Boreal Vulnerability Experiment (ABoVE) offers measures of vegetative cover and soil characteristics for sites along the James W. Dalton Highway (Alaska Route 11) in Alaska, USA. The data were collected in August 2018 and 2019 to study the expansion of shrub cover, particularly alders, in tundra ecosystems and the potential impact of shrubs on soil properties. The data, which are provided in comma-separated values (CSV) format, include the maximum annual Normalized Difference Vegetation Index (NDVI) for 2019 and the trend in maximum NDVI from 2000 to 2020.

Data access and more information about the ABoVE Alder Shrub Cover and Soil Properties dataset

ABoVE Spectral Reflectance and Ancillary Data, Tundra Transect, North Slope, Alaska, 2000-2022 Available

This ABoVE dataset provides visible-near infrared spectral reflectance, descriptions of vegetation cover, surface temperature, the total fraction of absorbed photosynthetically active radiation (fAPAR, 2001 only), permafrost active layer depth, elevation, and soil temperature at a depth of 5 centimeters. Measurements were made at every meter along a 100-meter (m) transect aligned mainly in an east-west direction and located approximately 300 m southeast of NOAA's Global Monitoring Laboratory (GML) baseline observatory near Utqiagvik, Alaska. Reflectance measurements were collected at nearly weekly intervals through the growing seasons of 2000 to 2002 to describe characteristics of green-up, peak growth, and senescence. Reflectance measurements were also collected once near peak growth in 2022. Ancillary measurements were collected at intervals through the 2001 and 2002 growing seasons.

Data access and more information about the ABoVE Spectral Reflectance and Ancillary Data, Tundra Transect, dataset

Level 2 Daily Solar-Induced Fluorescence (SIF) Data from MetOp-B GOME-2, 2013-2021 Released

Level 2 Solar-Induced Fluorescence (SIF) of chlorophyll estimates derived from observations captured by the Global Ozone Monitoring Experiment 2 (GOME-2) instrument on EUMETSAT's MetOp-B satellite are now available. The data are provided in netCDF format, range from April 1, 2013, to June 7, 2021, and each file contains daily raw and bias-adjusted SIF along with quality control information and ancillary data. SIF measurements can provide information on the functional status of vegetation including light-use efficiency and global primary productivity that can be used for global carbon cycle modeling and agricultural applications. The GOME-2 SIF product is inherently noisy owing to low signal levels and has undergone only a limited amount of validation.

Data access and more information about the SIF data

Now Available: Global Wetland Methane Emissions Data Derived from FLUXNET and the UpCH4 Model, 2001-2018

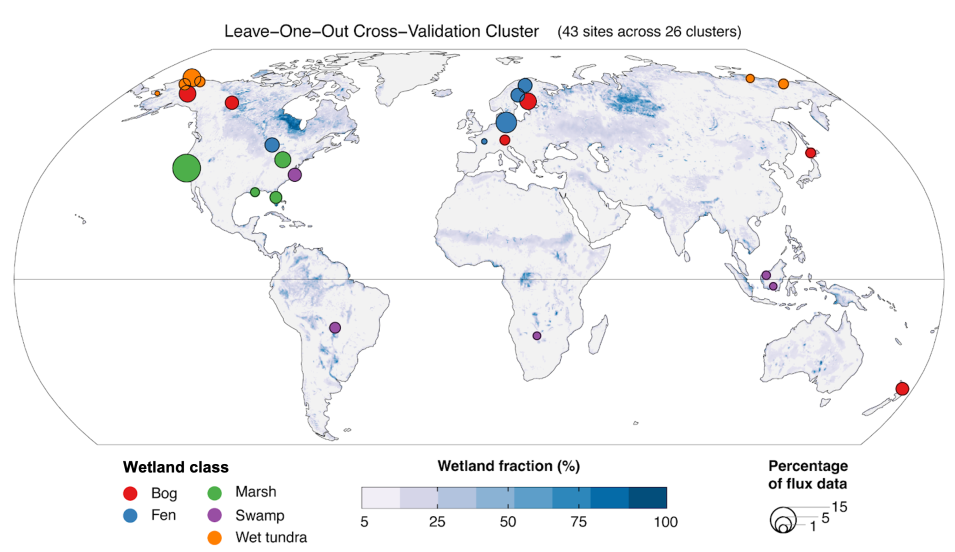
ORNL DAAC released a dataset providing monthly globally gridded freshwater wetland methane (CH4) emissions from 2001 to 2018. The data are derived from a six-predictor random forest upscaling model (UpCH4) trained on 119 site-years of eddy covariance CH4 flux data from 43 freshwater wetland sites covering bog, fen, marsh, swamp, and wet tundra wetland classes, and distributed across Arctic-boreal, temperate, and (sub)tropical climate zones. Weekly mean CH4 fluxes were computed from half-hourly FLUXNET-CH4 Version 1.0 fluxes.

This map shows the location, class, and size of 26 globally distributed freshwater wetland clusters. The size of each circle reflects the number of weekly CH4 fluxes in each cluster expressed as a percent of the total dataset of freshwater wetland methane emissions from 2001 to 2018.
Image Caption

Global map showing the location, class, and size of 26 globally distributed freshwater wetland clusters. The size of each circle reflects the number of weekly methane fluxes in each cluster expressed as a percent of the total dataset of freshwater wetland methane emissions from 2001 to 2018. Credit: NASA/ORNL.

The dataset includes mean daily fluxes with no adjustment for wetland area (i.e., flux densities assuming hypothetical 100% wetland cover); mean daily fluxes adjusting for Wetland Area and Dynamics for Methane Modeling (WAD2M) or Global Inundation Estimate from Multiple Satellites-2 (GIEMS-2) wetland area; and by-pixel monthly sum of freshwater wetland methane emissions adjusting for WAD2M or GIEMS-2 wetland area. All data are provided in netCDF4 format.

Data access and more information about the FLUXNET-CH4 data

PalEON: Terrestrial Ecosystem Model Drivers for the Northeastern U.S., 0850-2010

ORNL DAAC released a dataset of regional environmental and meteorological drivers from the PalEON Ecosystem Model Intercomparison Project (PEMIP), a coordinated effort to develop a set of terrestrial ecosystem model simulations with the ability to evaluate high-resolution ecophysiological causes and consequences of forest responses to climatic variability and change over the past millennium. The dataset consists of harmonized regional environmental and meteorological drivers at a resolution of 0.5 degrees for the North-Central and Northeastern U.S. from the year 850 to December 31, 2010.

Data access and more information about the PaIEON dataset

Lake Bathymetry Maps from Landsat and Random Forest Modeling, North Slope, Alaska

This dataset provides lake bathymetry maps derived from Landsat surface reflectance products for a portion of the North Slope area of Alaska. A random forest regression algorithm was used to generate depths for each point identified as being part of a lake, creating depth prediction files for each Landsat scene available for the study period—July 1, 2016, to August 31, 2018. These products are fitted to the ABoVE standard projection and reference grid to make them easily scalable and geometrically compatible with other products in the ABoVE study domain. The data are provided in COG format.

Data access and more information about the Lake Bathymetry Maps from Landsat

Physical Oceanography DAAC (PO.DAAC)

NOAA/STAR GHRSST Sea Surface Temperature Datasets Released

NASA's PO.DAAC released the NOAA/STAR Group for High Resolution Sea Surface Temperature (GHRSST) Level 3S (super-collated) version 2.81 Sea Surface Temperature (SST) datasets, produced from the low Earth orbit (LEO) JPSS Suomi NPP, NOAA-20, and NOAA-21 satellites; the Metop-FG (Metop-A, -B, -C) satellites; and NASA's Aqua and Terra satellites.

The Level 3S-LEO-PM and DY datasets are produced with the NOAA enterprise Advanced Clear Sky Processor for Ocean (ACSPO) v2.81 SST system and the datasets are formatted as netCDF4.

The near-real time data are produced with a 3- to 6-hour latency and then replaced with Re-ANalysis (RAN) files within approximately two months. Both datasets are described and discoverable via the PO.DAAC dataset information pages and are accessible via the Cloud OPeNDAP and Harmony API services.

Data access and more information about the GHRSST SST datasets

Introduction to Dask Jupyter Notebook Tutorial Now Available

PO.DAAC published a new tutorial on its website: The Basics of Xarray with Dask Parallization for Earth Data. This tutorial covers the basics of using Dask for parallel computing with NASA Earth science data completely in the cloud and features the Multiscale Ultrahigh Resolution (MUR) Global Foundation Sea Surface Temperature dataset.

Details

Last Updated

Published

Data Center/Project

Atmospheric Science Data Center (ASDC)
Goddard Earth Sciences Data and Information Services Center (GES DISC)
Global Hydrometeorology Resource Center DAAC (GHRC DAAC)
Level 1 and Atmosphere Archive and Distribution System DAAC (LAADS DAAC)
Land Processes DAAC (LP DAAC)
National Snow and Ice Data Center DAAC (NSIDC DAAC)
Oak Ridge National Laboratory DAAC (ORNL DAAC)
Physical Oceanography DAAC (PO.DAAC)