Dr. Kristin Poinar

Data from NASA’s NSIDC DAAC helps scientists like Dr. Kristin Poinar develop the next generation of models for forecasting sea-level rise from melting glaciers and ice sheets.

Dr. Kristin Poinar, Assistant Professor, Department of Geology, University at Buffalo

Research Interests: Earth's past and present glaciers and ice sheets, especially the Greenland Ice Sheet, the use of remote sensing and ground-based data to study and model the geological and hydrological processes that occur on or near these glaciers, the accelerated melting of Earth’s ice into the ocean, and sea level rise

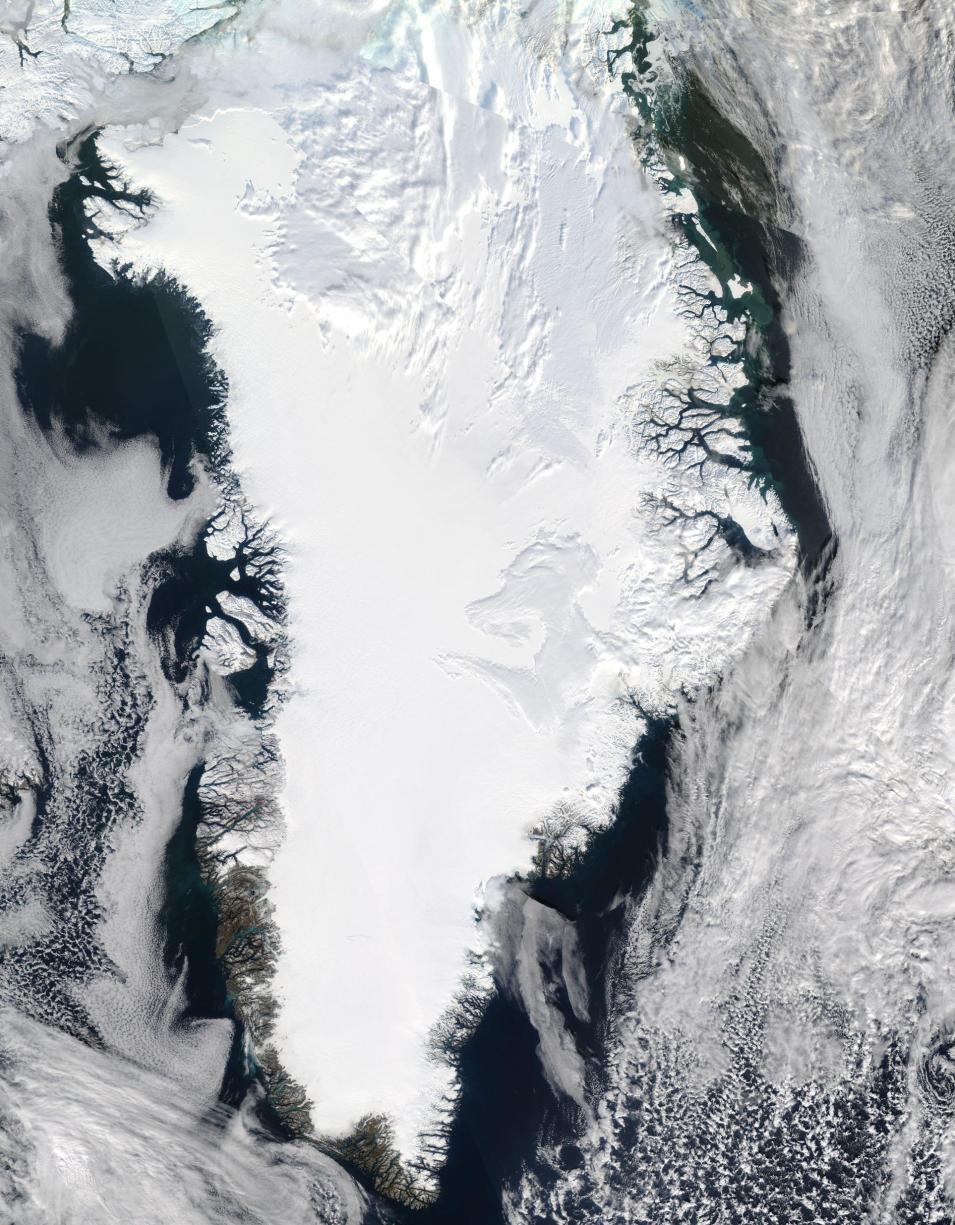
Research Highlights: If you look at true-color satellite imagery of Greenland, you’ll see that the vast majority of the island appears white throughout the year. This is because Greenland is covered by a 656,000 square-mile (1.7 million square kilometer) ice sheet known (rather appropriately) as the Greenland Ice Sheet.

Like glaciers, ice sheets form when snowfall accumulations exceed annual snowmelt. Over thousands of years, the layers of snow build up, forming a flowing sheet of ice thousands of feet thick and tens to thousands of miles across. As the ice thickens, the increasing height of snow and ice causes the ice sheet to deform. Ice sheets flow outward from their dome-like centers, where they are generally thickest. The flowing continues until the sheets encounter the ocean or the local weather is warm enough to melt the ice faster than the flow rate and the accumulation of winter snowfall. In areas where summer surface melt exceeds winter snowfall, old interior layers in the ice sheet are exposed, the ice sheet becomes thin, meltwater runs off the surface of the ice, and the ice sheet may terminate on land.

Drawing of an ice sheet showing lines of ice flow
Image Caption

Multiple factors, such as snowfall, ablation, underlying topography, ocean water, even simple gravity, all interact in shaping ice sheets. Image from Landsat Image Mosaic of Antarctica (LIMA). Credit: NSIDC.

In recent years, scientists who study the cryosphere have been monitoring ice sheet mass balance — a term for the difference between total snow input and the snow and ice lost through melting, ablation (i.e., the combination of processes that remove snow or ice from the surface of a glacier or ice sheet), and calving from glaciers and ice shelves. Because ice sheets contain so much ice and have the potential to raise or lower global sea level so dramatically, measuring the mass balance of ice sheets, tracking changes in mass balance changes, and determining the cause of such changes has become an important area of research.

Among the scientists working to better understand the relationship is Dr. Kristin Poinar, Assistant Professor in the Department of Geology and the Research and Education in eNergy, Environment and Water (RENEW) Institute at the University at Buffalo, who studies and models the geological and hydrological processes that affect ice flow and sea level rise from melting glaciers and ice sheets.

“I am interested in Earth's glaciers and ice sheets, especially the Greenland Ice Sheet, as well as both ice sheets in Antarctica, glaciers in Alaska, Iceland, and the Himalayas, and past ice sheets like the Laurentide and Cordilleran,” she said. “I zoom in to study particular processes that occur on or near these glaciers, like the formation of crevasses, interactions between meltwater and ice flow, the water network within and underneath glaciers, and how the weight of the ice deforms the lithosphere beneath a large glacier.”

Poinar is a self-described “modeler” – she writes and applies numeric models that represent a process, or a small collection of processes, that affect ice flow and ice melt — and because she is motivated by the acceleration of Earth's land ice into the ocean, much of her work focuses on improving models’ ability to forecast sea level rise from Greenland ice.

Satellite image of Greenland covered in ice/snow.
Image Caption

NASA's Aqua satellite captured this true-color image of Greenland on September 26, 2021, that shows areas of ice melt along the island's southern and southwestern coasts. According to information from NSIDC DAAC, surface melting of the Greenland Ice Sheet in 2021 was above the 1981 to 2010 average, and extended far higher in elevation than is typical even in recent years. Credit NASA Worldview.

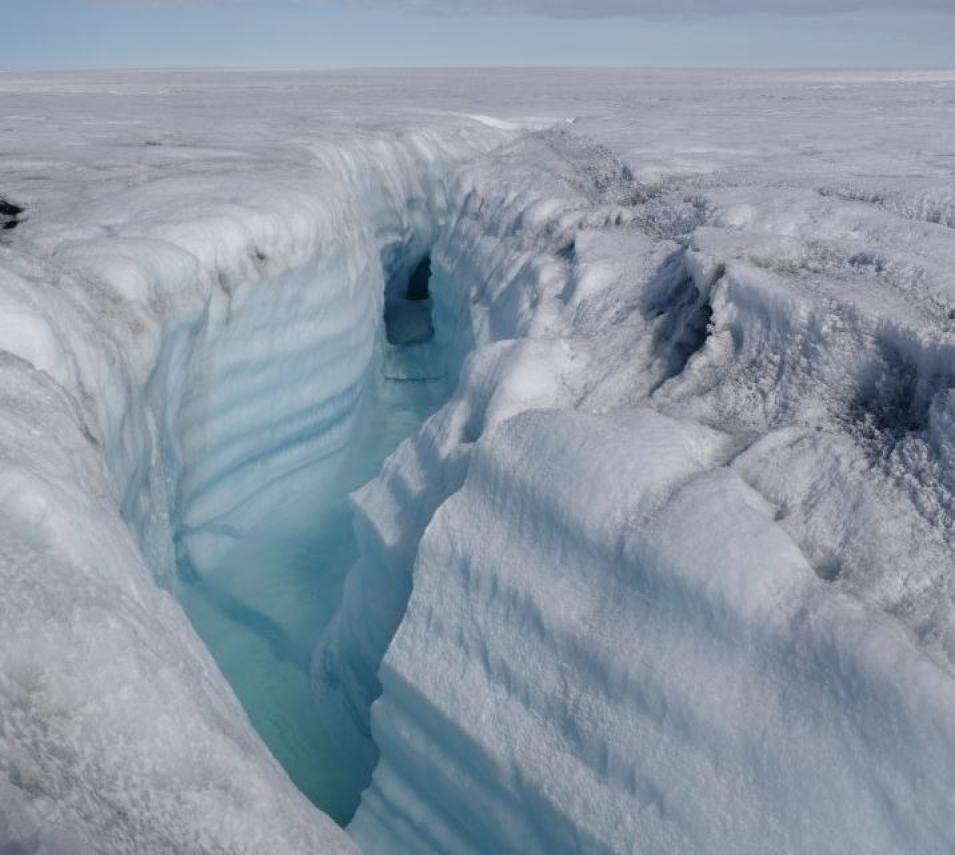
“In Greenland, I am working on understanding how meltwater, formed at the ice-sheet surface during warm summer periods, makes it to the base of the ice sheet, where it affects ice flow and sea level rise,” she said. “In western Greenland, this primarily happens through nearly vertical shafts called moulins, which carry rushing meltwater straight down to the bed as a waterfall inside the glacier. When the water reaches the base of the ice sheet, it joins the subglacial hydrologic system and affects how much the water speeds up or, counterintuitively, slows down the flow of the ice.”

For this reason, says Poinar, the glaciological community needs to know the location of the moulins that exist today as well as those that will form in the future. Scientists have scrutinized satellite imagery to create maps of current moulin locations, but as of now, there is no way to forecast whether they will form in new places as the climate warms and the shape of the Greenland Ice Sheet changes.

“Most of today's ice sheet and climate models do not include moulins at all. Instead, they instantly transfer any surface meltwater directly to the nearest location in the ocean. This skips the effect that moulins and subglacial meltwater have on ice flow,” Poinar said. “The eventual inclusion of these systems in the next generation of ice sheet and climate models is an important research frontier if we are going to accurately forecast future sea-level rise from Greenland.”

In addition to her role as assistant professor, Poinar is also a member of NASA’s National Snow and Ice Data Center Distributed Active Archive Center’s (NSIDC DAAC) User Working Group, which suggests specific data products and services to NASA and the NSIDC DAAC and represents the data user community in the development and operation of NSIDC DAAC products and services.

Located in Boulder, Colorado, NSIDC DAAC is part of the Cooperative Institute for Research in Environmental Sciences, a joint institute of University of Colorado Boulder and NOAA. NSIDC DAAC archives and distributes data and provides tools and resources in NASA’s Earth Observing System Data and Information System (EOSDIS) collection that pertain to snow and ice processes, particularly in regard to interactions among snow, ice, the atmosphere, and the ocean.

Among the NASA EOSDIS products from NSIDC that Dr. Poinar uses in her research are those from NASA's Operation IceBridge, which describe annual changes in ice surface elevation; the topography of bedrock under ice sheets, glaciers, and ice shelf grounding lines; snow and ice thickness; sea ice distribution; ice temperature; and meteorological observations. She also uses data from NASA’s Ice, Cloud, and land Elevation Satellite-2 (ICESat-2) mission, which was initiated to help scientists investigate why and how much the cryosphere is changing as the climate warms. ICESat-2 data also provide scientists with the information they need to track changes of terrain including glaciers, sea ice, and more.

Image of a moulin.
Image Caption

A moulin on the Greenland Ice Sheet. An incised stream (foreground) feeds water to the moulin (background), from where it travels nearly straight down hundreds of meters to the base of the ice sheet. Credit: Celia Trunz, University at Buffalo and Université de Sherbrooke, Quebec.

“The moulin project in western Greenland uses Advanced Topographic Laser Altimeter System (ATLAS) instrument data from ICESat-2 to study the changing topography of the ice near moulins, including bathymetry (i.e., the study of water body beds) of the supraglacial lakes closely involved with moulin formation,” Poinar said. “We also use NSIDC high-resolution ice sheet velocity data and NASA Land Processes DAAC (LP DAAC) reflectance data from the Moderate Resolution Imaging Spectroradiometer (MODIS) instrument aboard NASA’s Aqua and Terra satellites and the joint NASA/USGS Landsat mission to identify when moulins initiate and to characterize the features of the ice sheet where they form.”

Poinar, along with Lauren C. Andrews of NASA's Goddard Space Flight Center Global Modeling and Assimilation Office, documented the use these satellite data products in a 2021 paper published in The Cryosphere. The paper details their efforts to identify controls on the drainage dates of supraglacial lakes so that the locations and timing of seasonal water input to the bed across the ablation zone of western Greenland (i.e., the low-altitude area of the ice sheet) can be defined in future climate scenarios.

The researchers found that lake elevation and date of melt onset were meaningful predictors of the timing of fast lake drainage, but that these factors alone are not enough to make accurate predictions.

“The moulin research has shown that the timing within the melt season wherein a moulin first begins conveying water to the bed is difficult to predict with existing data,” Poinar said. “However, the locations of moulins on today's ice sheet, as well as on future versions of Greenland, are possible to constrain. We are working with a new, computationally efficient model that we are running millions of times through plausible future scenarios in order to constrain where moulins are likely to form in the future.”

Poinar also uses radar and airborne lidar data from Operation IceBridge in her investigations of the how surface meltwater on ice in eastern Greenland makes its way to the ocean.

“In much of eastern Greenland, surface meltwater sinks down slowly through thick snow and firn [snow that is in the process of densifying into ice] and reaches interior aquifers, buried tens of meters below the surface within the glacier. From here, the water amassed in the aquifer seeps slowly downhill for tens of kilometers, until it finds a tiny crevasse,” she said. “Over weeks, months, or perhaps even years, the slow accumulation of water weighs into the crevasse and drives it deeper and deeper, until it reaches the bed a thousand meters below. From there, the water travels swiftly to the ocean.”

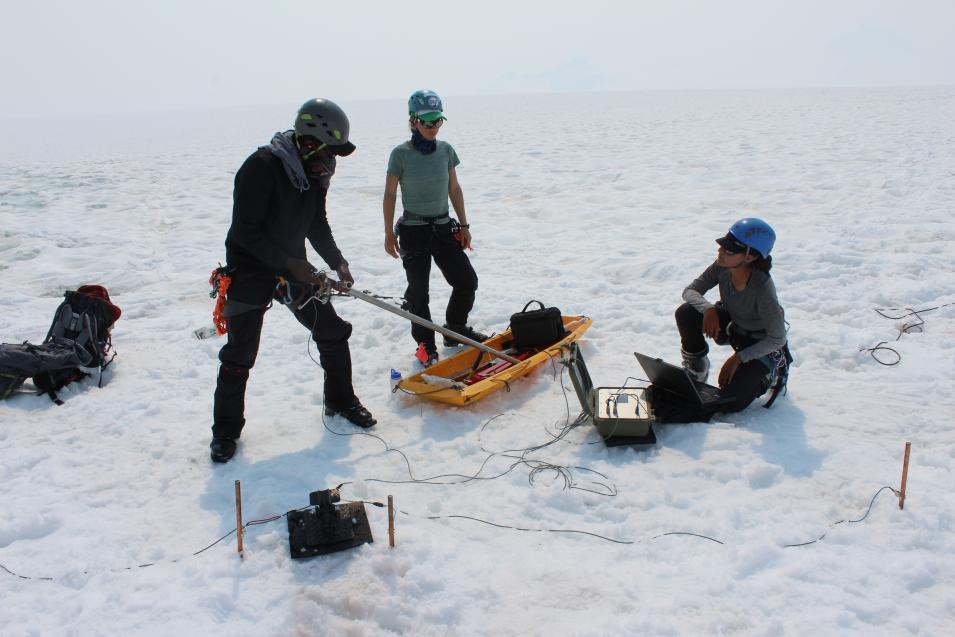
Three scientists conducting research on an ice sheet
Image Caption

Dr. Erasmus Oware (left), Dr. Kristin Poinar (center), both of the University at Buffalo, and Juneau Icefield Research Program student Diana Castro of California State University deploy a geophysics experiment on Taku Glacier, Alaska, in July 2019. Since 2013, Taku Glacier has been retreating and its surface has been melting downward at an average rate of 1.3 meters per year. Credit: Dr. Kristin Poinar.

According to Poinar, it isn’t clear if the aquifer provides a year-round source of water to the bed or if it is seasonal (summer only) like it is in western Greenland. If the aquifer flows year-round, it likely maintains a more stable network of water channels than is typically found under most glaciers. This would lead to steadier ice flow over the calendar year, limiting the fast lurches that typically happen in spring and summer and, somewhat counterintuitively, reduce the overall amount of ice that flows into the ocean in this part of Greenland.

Data products from Operation IceBridge and ICESat-2 are helping Poinar and her fellow researchers answer some of these questions.

“The Operation IceBridge radar and airborne lidar data allow us to identify water trapped in the aquifer inside the glacier — we can clearly see its upper surface some tens of meters below the top of the ice — and locate the crevasses that drain the aquifer,” said Poinar. “The large influx of water makes these crevasses wider than expected, and we are honing an algorithm to discriminate these special crevasses that connect the aquifer to the bed.”

Poinar and her colleagues detailed this research in a paper published in Frontiers in Earth Science in 2017. Their work revealed that, “most likely, nearly all water in Greenland firn aquifers discharges through crevasses” and that “these crevasses carry the water all the way to the bed, certainly in some locations and most likely in many or most locations.”

These findings are significant, as they help to close the gaps in the water budget of the ice sheet, she said.

Naturally, more work is necessary to develop the next generation of ice sheet and climate models that will improve forecasts of sea-level rise from Greenland’s glaciers and ice sheets. Poinar’s research demonstrates how Earth science data from NSIDC DAAC and other DAACs in NASA’s EOSDIS collection help scientists better understand the interactions among Earth system components.

Representative Data Products Used or Created:

Available through NSIDC DAAC:

Other data products used:

Read about the Research:

Poinar, K. & Andrews, L. (2021). Challenges in predicting Greenland supraglacial lake drainages at the regional scale. The Cryosphere, 15(3): 1455-1483. doi:10.5194/tc-15-1455-2021

Sperhac, J., Poinar, K., Jones-Ivey, R., Briner, J., Csatho, B., Nowicki, S., Simon, E., Larour, E., Quinn, J., & Patra, A. (2020). GHub: Building a glaciology gateway to unify a community. Concurrency and Computation: Practice and Experience, 33(9): e6130-14. doi:10.1002/cpe.6130

Poinar, K., Joughin, I., Lilien, D., Brucker, L., Kehrl, L., & Nowicki, S. (2017). Drainage of Southeast Greenland Firn Aquifer Water through Crevasses to the Bed. Frontiers in Earth Science, 5: 8-15. doi:10.3389/feart.2017.00005

Explore more Data User Profiles

Details

Last Updated

Data Center/Project

National Snow and Ice Data Center DAAC (NSIDC DAAC)