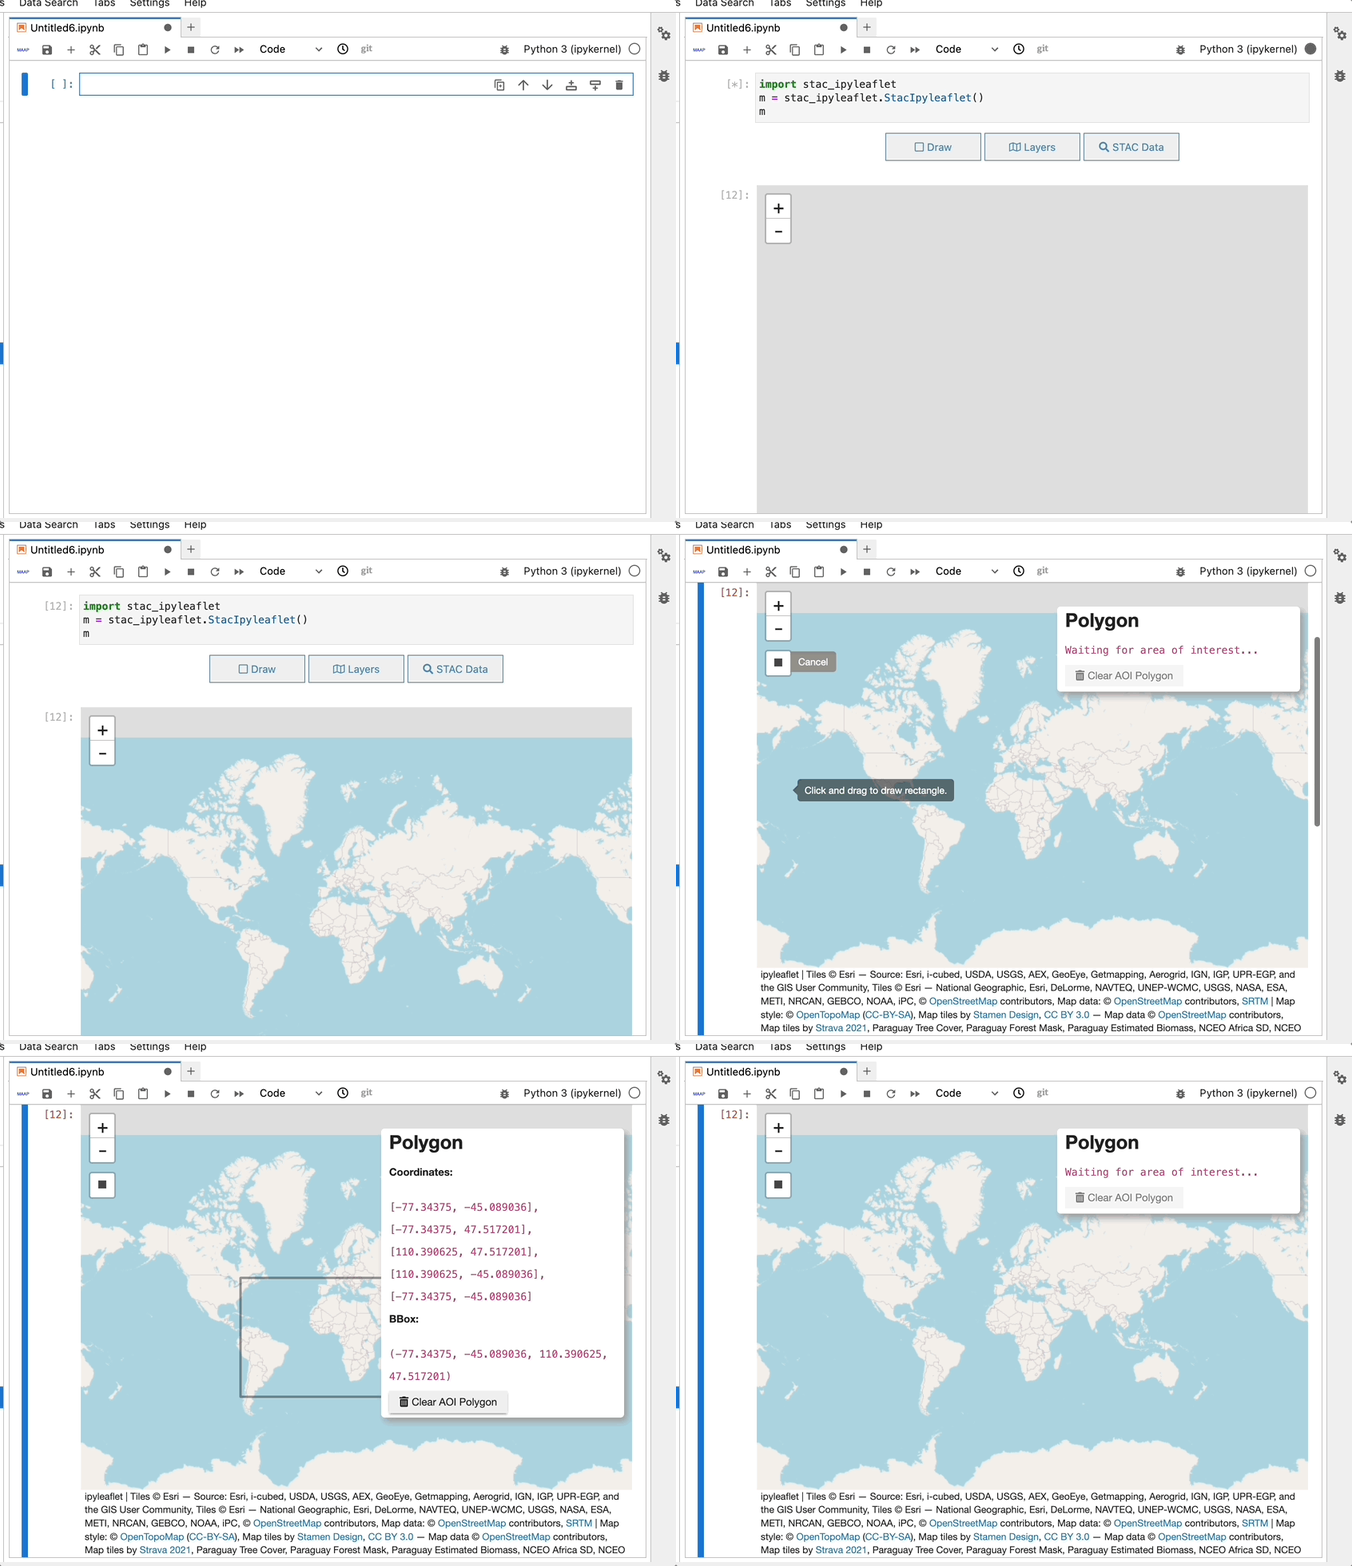
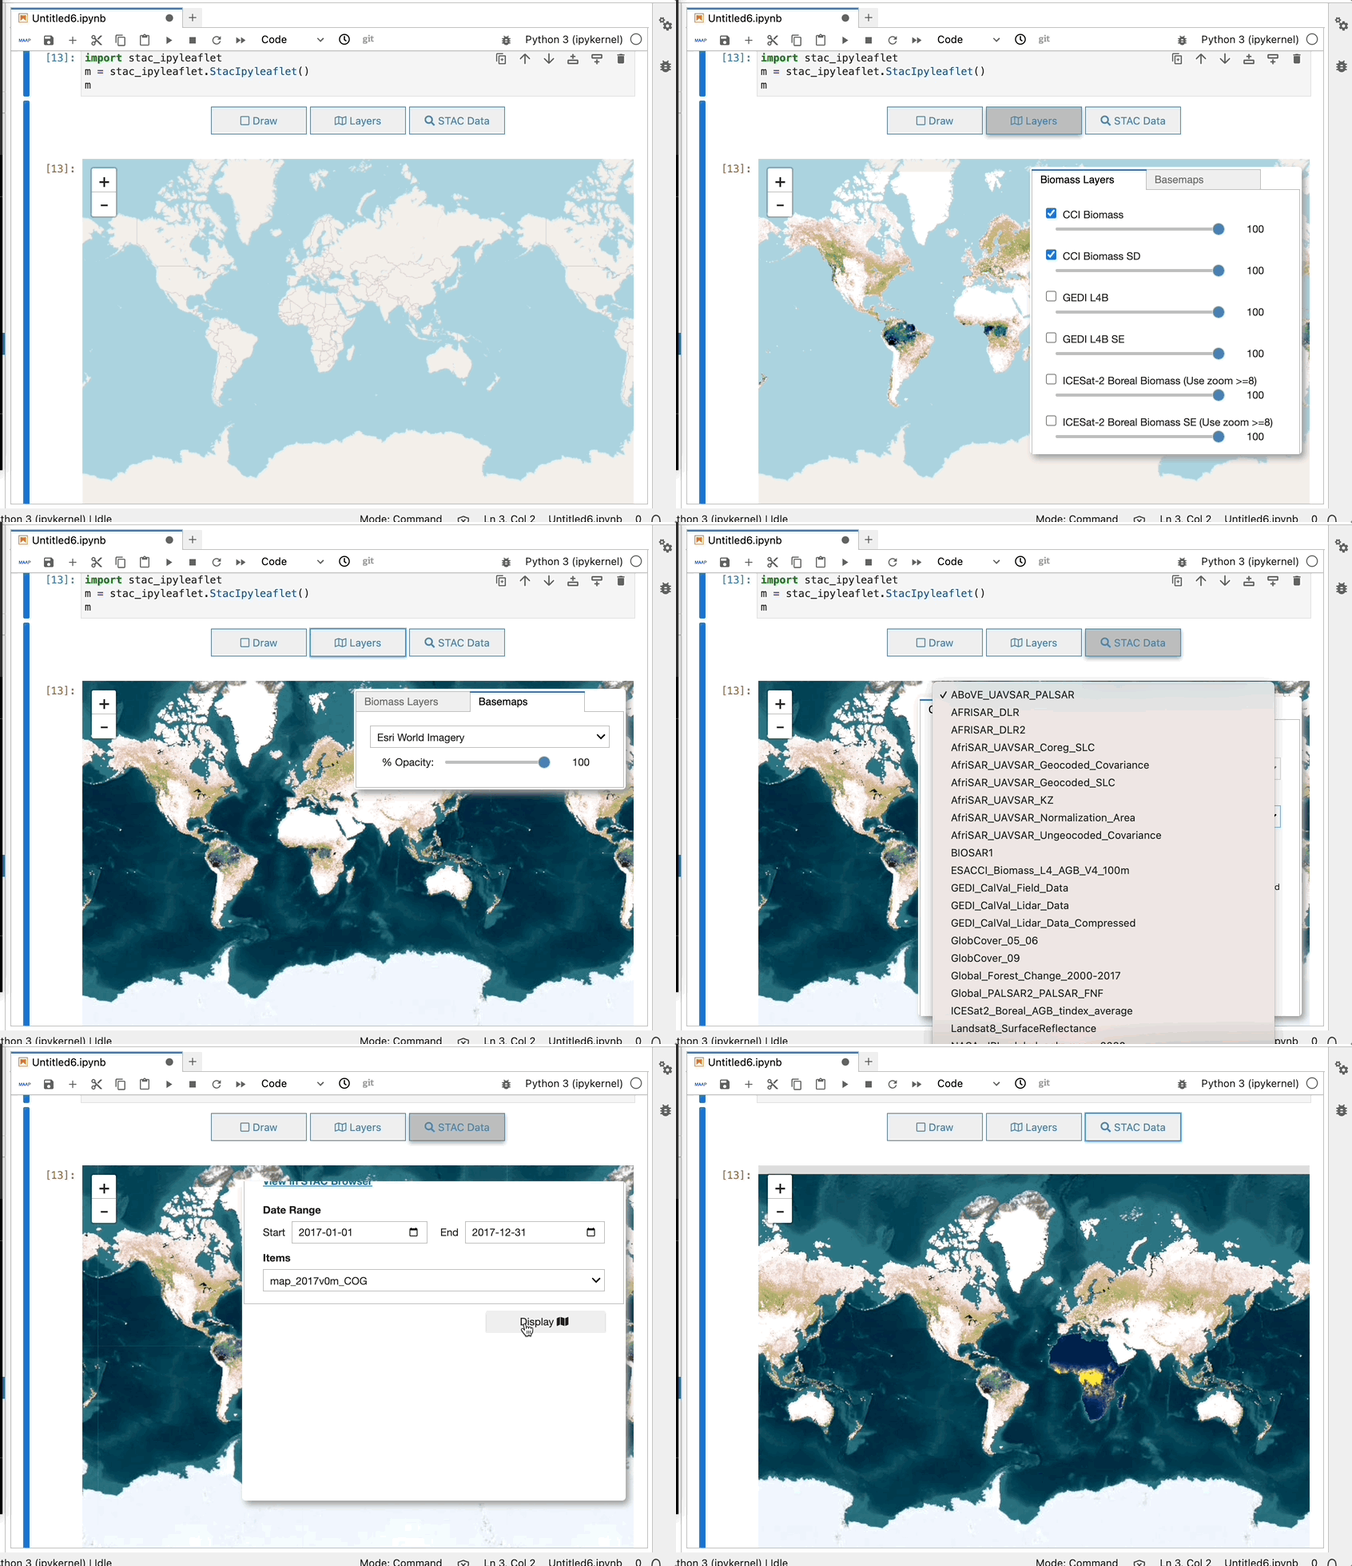
On May 25, 2023, the Multi-Mission Algorithm and Analysis Platform (MAAP) team unveiled stac_ipyleaflet, the latest addition to MAAP user tool boxes. Built on top of ipyleaflet, this open-source tool allows users to make interactive maps in a Jupyter notebook, mixing data published in the MAAP Spatial Temporal Asset Catalogs (STAC), with users’ local data.
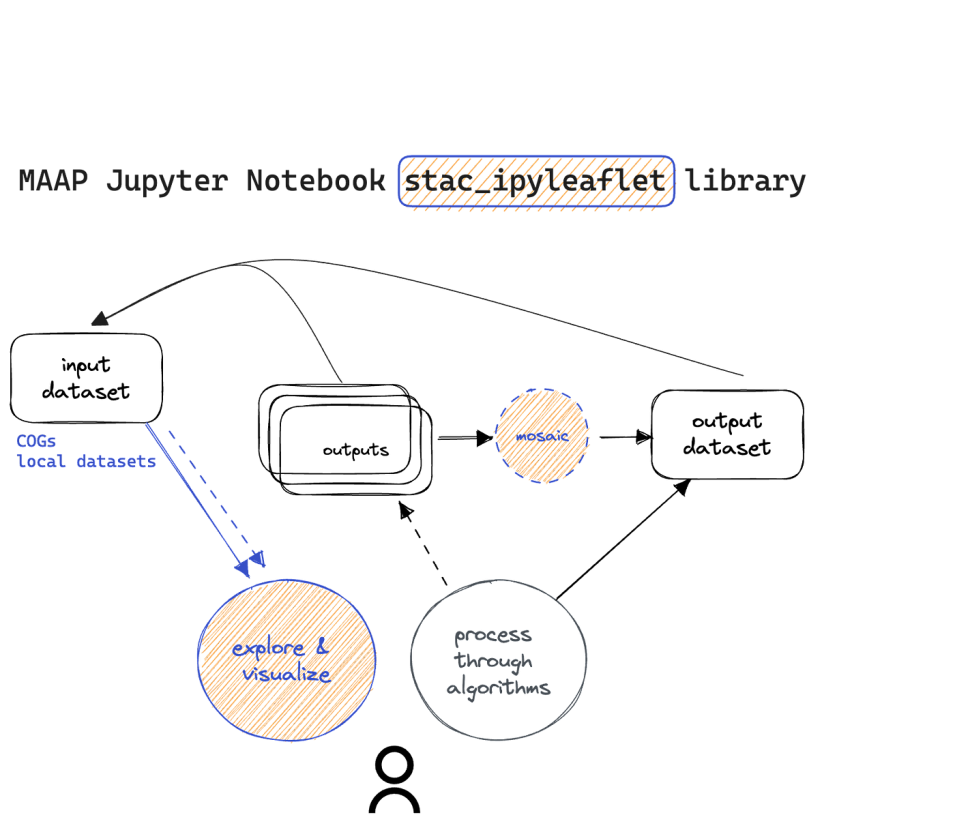
MAAP provides an online collaborative code development environment in a web browser, enabling users to easily access, share, and process aboveground biomass data and code (learn more on the MAAP Dashboard). While the MAAP includes a visualization dashboard for intuitive data exploration in a browser, stac_ipyleaflet allows MAAP users to programmatically visualize any data cataloged in STAC, along with their own data, in an interactive map. Users can pan, zoom, and– in the future– add color customization, inquiry, and custom STAC query capabilities. This functionality makes it significantly easier to visualize data from cloud storage and create mosaics of large amounts of data.
The stac_ipyleaflet tool introduces the ability to search and add data, such as biomass layers, from a STAC catalog. These are offered as Cloud-Optimized GeoTIFFs. The user then adds data layers onto an interactive map inside a code notebook analysis environment (Jupyter). The tool also uses Jupyter Widgets (aka ipywidgets), allowing for user-generated code to modify the map and use the map to help write code for other users.


