Mobile Menu
Skip to main content
  • About
  • Data
  • Collaborate
  • Learn

Floods

  1. Learn
  2. Data Toolkits
  3. Disasters Data Toolkit
  4. Floods
Share on Twitter Share on Facebook Share on Pinterest

With approximately 40% of the world's population living within 100 kilometers (km) of the coast, floods affect more people worldwide than any other type of natural disaster. The number and frequency of flooding events is increasing in part due to climate change with coastal and low-lying areas being particularly vulnerable due to years of relative sea level increases and an increase in extreme weather events.

Discover Data

Terra Moderate Resolution Imaging Spectroradiometer (MODIS) Daily Snow Cover in Earthdata Search

Terra Moderate Resolution Imaging Spectroradiometer (MODIS) Daily Snow Cover in Earthdata Search. Earthdata Search is a data discovery application that enables access to NASA Earth Observing System Data and Information System (EOSDIS) Earth science data that are archived at and distributed by EOSDIS Distributed Active Archive Centers (DAACs).

Discover Flood Data

Photo of raindrops on metal.

Rainfall

Any place where rain falls is susceptible to flooding. Measuring rainfall helps advance our understanding of Earth's water cycle, improving forecasts of extreme events such as flooding.

  • Discover Rain Data in Earthdata Search
  • Rain Data at NASA's Goddard Earth Sciences Data and Information Services Center (GES DISC)
  • Rain Data at NASA's Global Hydrology Resource Center Distributed Active Archive Center (GHRC DAAC)
  • Interactively explore Rain Data in NASA Worldview

Webinars

  • Data Access and Visualization of Model Data at NASA GES DISC
  • NetCD-what? An Ecologist’s Guide to Working with Daymet and other NetCDF-formatted Data
  • Tropical Rainfall Measuring Mission (TRMM) and Global Precipitation Measurement (GPM) Precipitation Products and Services at NASA GES DISC

Data Tutorials/Recipes

  • Daymet Single Pixel Data Extraction: Web Services
  • How to Import MERRA Surface Product Data into ArcGIS
  • How to Obtain Data for Conducting Hurricane Case Study

Measuring snow depth

Snow Cover and Snow Water Equivalent

Both seasonal and long-term changes to snow cover can impact the amount of water flowing through watersheds, resulting in a water deficit or a water abundance. The amount of snow pack and timing of snow melt affects flood risk.

Snow Cover

  • Citizen Science on Snow
  • Discover Snow Data in Earthdata Search
  • Snow Data at NSIDC DAAC
  • Interactively explore Snow Data in NASA Worldview

Snow Water Equivalent (SWE)

  • Discover SWE Data in Earthdata Search
  • SWE at NSIDC DAAC
  • Interactively explore SWE Data in NASA Worldview

Webinars

  • Let It Snow! Accessing and Analyzing Snow Data at NSIDC DAAC
  • Discovering and Differentiating Data with NSIDC Search

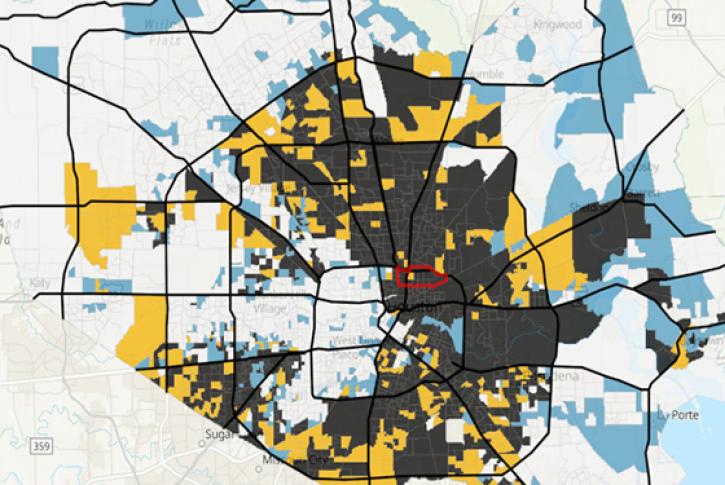
Gridded Population of the World,Version 4(GPWv4):Population Density consists of estimates of human population density based on counts consistent with national censuses and population registers for the years 2000, 2005, 2010, 2015, and 2020. Credit Socioeconomic Data and Applications Center

Socioeconomic Flood-related Data

Socioeconomic data help assess the exposure and vulnerability of a community to a disaster. Exposure is the presence of people, ecosystems, and infrastructure in places that could be adversely affected by a disaster. Vulnerability is the propensity to be adversely affected by a disaster.

Flood

  • Discover flood-related socioeconomic data in Earthdata Search
  • Discover Global Man-made Impervious Surface (GMIS) data in Earthdata Search
  • Interactively explore flood-related socioeconomic data in NASA Worldview
  • Flood-related data at NASA's Socioeconomic Data and Applications Center (SEDAC)

Population

  • Discover Population Data in Earthdata Search
  • Interacvtively explore Population Data in NASA Worldview
  • Estimate Population in a User-Defined Area at SEDAC
  • Population Data at SEDAC

Webinars

  • Gridded Population and Settlement Data: An Introduction to the POPGRID Data Collaborative
  • Mapping Global Urbanization from Landsat Data and High-Resolution Reference Data
  • Remote Sensing Derived Environmental Indicators for Decision Making

Data Tutorials/Recipes

  • How to use SEDAC’s Mapping Tool to Visualize Human Built-up and Settlement Extent (HBASE) and Global Man-made Impervious Surface (GMIS) Datasets
  • Introduction to the SEDAC Population Estimation Service and Mapping Tool

Remote sensing data can be used to identify the vulnerability, exposure, and flooding risk of communities as well as help mitigate the social and economic impacts. NASA Earth observations can help scientists, application-based users, and decision makers understand factors contributing to flood events, respond to events in near real-time, and map flood inundation and its impacts post-event. This toolkit is designed to support this research by providing easy access to data and other resources.

Visualize and Interactively Explore Data

Visualization of the Joint NOAA/NASA Suomi National Polar-orbiting Partnership Visible Infrared Imaging Radiometer Suite (VIIRS) Corrected Reflectance, Bands 11-I2-I1 in Worldview.

Visualization of the Joint NOAA/NASA Suomi National Polar-orbiting Partnership Visible Infrared Imaging Radiometer Suite (VIIRS) Corrected Reflectance, Bands 11-I2-I1 in Worldview. NASA’s EOSDIS Worldview imagery mapping and visualization application provides the capability to interactively browse global, full-resolution satellite imagery layers.

Photo of a sheet of ice over soil.

Soil Moisture

Understanding soil moisture aids in improving weather forecasts and predicting floods. Soil moisture controls the amount of water that can infiltrate the ground, replenish our aquifers, or contribute to excess runoff.

  • Discover Soil Moisture Data in Earthdata Search
  • Soil Moisture Data at NASA's GES DISC
  • Soil Moisture Data at NASA's National Snow and Ice Data Center DAAC (NSIDC DAAC)
  • Soils Data at NASA's Oak Ridge National Laboratory DAAC (ORNL DAAC)
  • Interactively explore Soil Moisture Data in NASA Worldview

Webinars

  • NASA's Soil Moisture Active Passive (SMAP) Mission Data Products

Data Tutorials/Recipes

  • Download and Visualize SMAP Data using Python
  • Learn how to Search, Order, and Customize SMAP Data using Earthdata Search

GDEM Version 3 shaded relief topography of San Francisco. Credit: Land Processes DAAC

Topography

Knowing local topography is essential for disaster managers and emergency management professionals seeking to assess an area's risk level; knowing the height at which communities sit in relation to flood waters determines the exposure.

  • Discover Topography Data in Earthdata Search
  • Interactively explore Topography in NASA Worldview
  • Land Surface Topography/Elevation Data at NASA's Land Processes DAAC (LP DAAC)

Data Recipes/Tutorials

  • Looking to Fill the Voids? NASADEM is Here!
  • Working with Land Remote Sensing Data in a GIS Environment

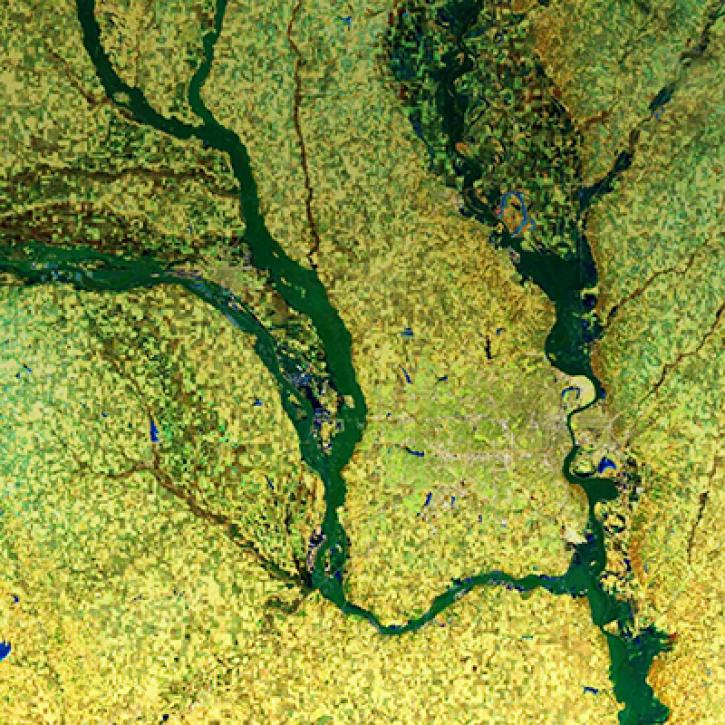
Flood inundation in midwest US. Credit: NASA Applied Sciences Disasters program

Flood Inundation with Land Surface Reflectance

Understanding and mapping flood inundation is critical to assessing the scope of the disaster, where the damage is greatest, and where to respond with relief efforts.

  • Discover Land Surface Reflectance Data in Earthdata Search
  • Interactively explore Land Surface Reflectance in NASA Worldview
  • Interactively explore MODIS Corrected Reflectance Bands 7-2-1 in NASA Worldview
  • Interactively explore VIIRS Corrected Reflectance Bands 11-I2-I1 in NASA Worldview
  • Surface Reflectance Data at NASA's LP DAAC

Webinars

  • NASA ORNL DAAC MODIS and VIIRS Data Tools and Services at your Fingertips
  • Navigating NASA's LP DAAC to Find Answers to your Deepest Land Data Questions
  • R you Ready to Python? An Introduction to Working with Land Remote Sensing Data in R and Python
  • Exploring Earth’s Land Surface with Suomi NPP NASA VIIRS Land Data

Data Tutorials/Recipes

  • Getting Started with VIIRS Surface Reflectance Data: All about Accessing the Data
  • Getting Started with VIIRS Surface Reflectance Data: Using the Data
  • Getting Started with NASA MODIS Version 6 Surface Reflectance Data: Accessing the Data
  • Getting Started with NASA MODIS Version 6 Surface Reflectance Data: Using the Data
  • Getting Started with NASA MODIS Version 6 Surface Reflectance Data: Interpreting Quality Information
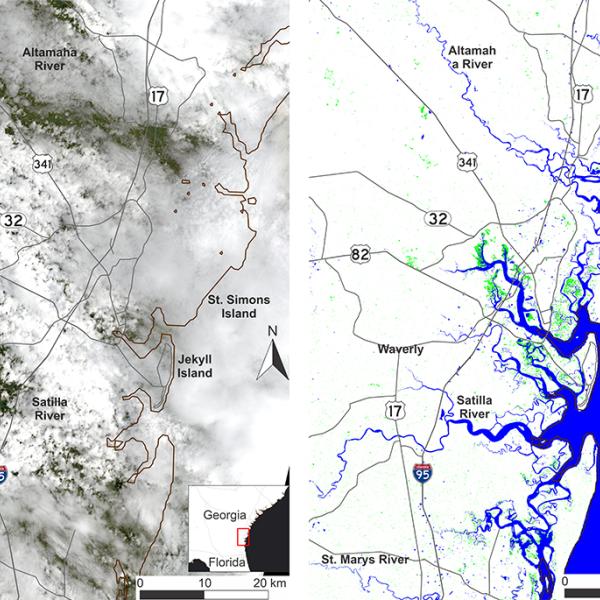
SMAP Radar Mosaic of the Amazon

Flood Inundation with Synthetic Aperture Radar (SAR)

Understanding and mapping flood inundation is critical to assessing the scope of the disaster, where the damage is greatest, and where to respond with relief efforts. The wavelengths used for creating SAR imagery can penetrate clouds, smoke, soil, ice, and tree canopies, meaning that high-relief SAR imagery can be created day or night, rain or shine. SAR imagery can be used to assess post-storm flood and storm-surge damage along with shoreline changes.

  • Discover SAR Data in Earthdata Search
  • SAR Data at NASA's Alaska Satellite Facility DAAC (ASF DAAC)

Webinars

  • Introduction to SAR
  • Applications of SAR Data in GIS Environments

Data Tutorials/Recipes

  • What is SAR?
  • How to Map Regional Inundation with Spaceborne L-band SAR using ArcGIS
  • How to Map Regional Inundation with Spaceborne L-band SAR using QGIS
  • How to Map Regional Inundation with Sentinel-1 using Sentinel-1 Toolbox

Getting Started

About the Data

NASA provides data from a variety of sources including satellites, airborne campaigns, field campaigns, in situ instruments and model outputs. NASA's Earth Observing System Data and Information System (EOSDIS) offers a wide variety of freely and openly available data that can be used to evaluate disaster-related events. 


Data User Profiles

Dr. Emily Berndt uses NASA Earth science data to study how to improve short-term forecasts of high-impact weather.
Dr. Xiaofeng Li uses NASA Earth science data to study atmospheric and oceanic processes.
Dr. Pierre Kirstetter uses NASA Earth science data for improving our understanding of precipitation and flooding.
Dr. Brian Mapes uses NASA Earth science data to study large-scale weather and climate processes. 


Data Pathfinders

Floods Data Pathfinder
Disasters Data Pathfinder 


Feature Articles
Read about how researchers are using NASA satellite, field campaign, and model data to study natural disasters, the impacts of these disasters, and ways to mitigate risk and exposure.


Published October 21, 2020

Links

  • Screenshot of Earthdata Search showing western US and precipitation data.
    Discover and Access NASA's Earth Science Data with Earthdata Search

  • Screenshot of Worldview showing daily accumulated precipitation from Integrated Multi-satellitE Retrievals for GPM (IMERG).
    Getting Started with NASA Worldview

  • High Aerosol Optical Depth over Northern India - feature grid
    Discover Earth Science Data Learning Resources at NASA Earthdata

Page Last Updated: Feb 9, 2021 at 9:30 AM EST

Related Articles

  • Getting Ready for NISAR - and for Managing Big Data using the Commercial Cloud
  • The Flood Hunters
  • Hurricane Idai in Worldview

Discover Data and Services

  • Earthdata Search
  • Dataset Directory GCMD
  • Data Tools

@NASAEarthdata

Loading Tweets by NASAEarthdata...

We're sorry. Our Twitter feed cannot load right now.

In the meantime, visit us below!

@NASAEarthdata

ABOUT

DATA

COLLABORATE

LEARN

USER RESOURCES

SUPPORT

NASA Links

  • NASA Official: Stephen Berrick
  • Web Privacy Policy
  • Data and Information Policy
  • Communications Policy
  • Freedom of Information Act
  • USA.gov
  • Sitemap