In September 2010, more than a hundred scientists watched and waited as a tropical depression hovering over the Caribbean Sea swirled and formed into Tropical Storm Karl. Two days later, as the storm quickly intensified into a Category 3 hurricane near Mexico, the scientists pounced. Three aircraft with their payloads of sensors flew right into Karl to profile the storm’s innards—violently rotating wind and clouds, and torrential rains that fell on the southern bend of the Gulf of Mexico.
Once More into the Storm

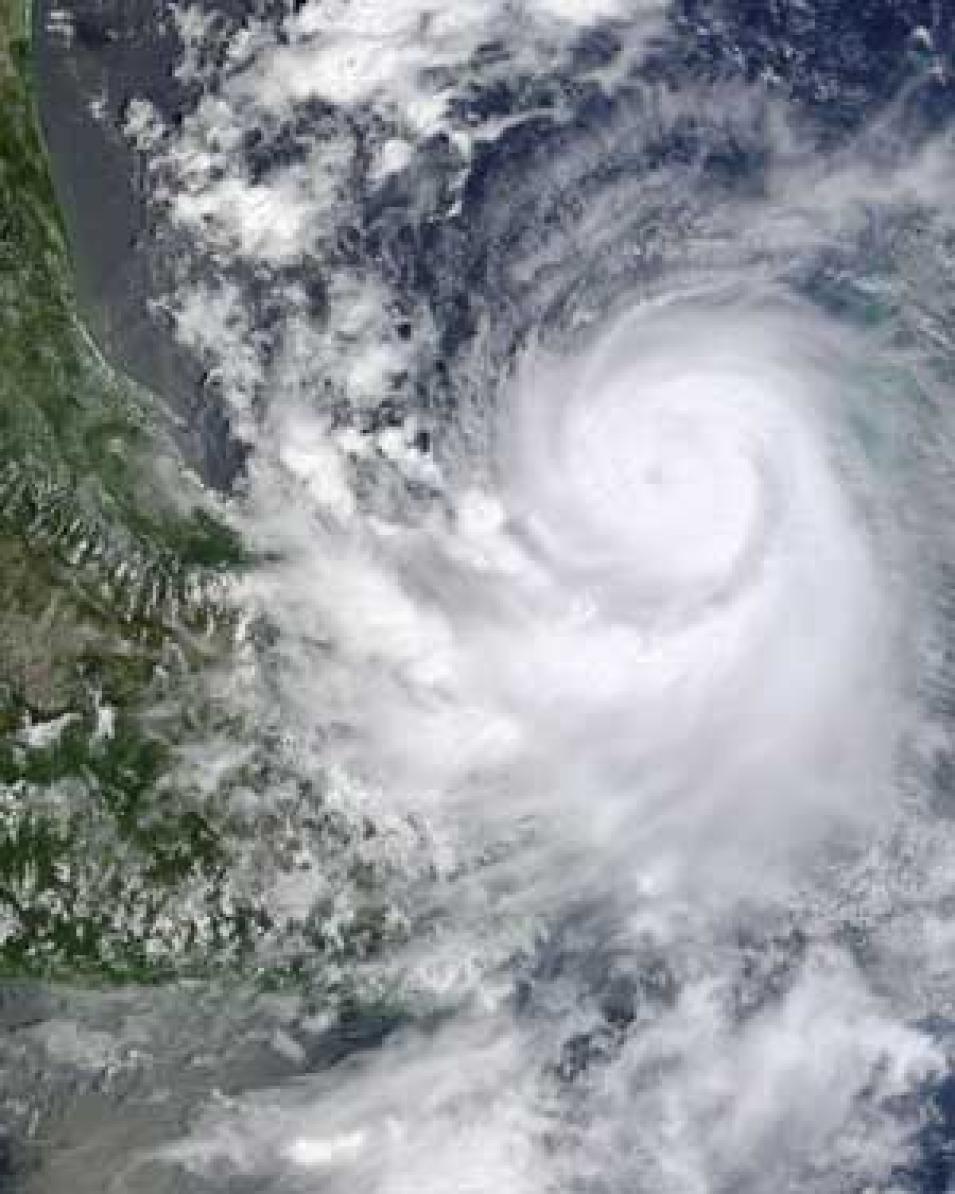
Hurricane Karl thrashes Mexico in September 2010. Karl surprised hurricane forecasters with its rapid intensification from a tropical depression to a Category 3 hurricane. (Courtesy MODIS Rapid Response Team, NASA GSFC)
“Karl may just be one of the most studied hurricanes ever,” said meteorology professor Ed Zipser at the University of Utah, who was on the DC-8 aircraft and in the churning hurricane that day. Zipser and his colleagues hope that the data they collected from Karl, as well as from several other storms during the 2010 Atlantic hurricane season, will help them illuminate a dark secret of hurricanes. Just what is it that makes a storm like Karl rapidly intensify into powerful hurricane in such a short time? And what makes others fizzle out?
Gripping hurricanes
Scientists have long thought that hot towers—cumulonimbus clouds that carry warm, moist air from near the ocean surface in strong updrafts high into the atmosphere—play a huge role in hurricane intensification. The warmer the ocean water, the more energy powering a storm’s churning, the more intense it is likely to grow. But this is only one theory among many that scientists are constantly probing. “There are a whole bunch of hypotheses about how hurricanes form and intensify,” said Scott Braun, a hurricane computer modeler at NASA's Goddard Space Flight Center. “And we often have a major shortage of observations to prove or disprove those hypotheses.”
Braun and Zipser are two of about three hundred scientists, engineers, pilots, and crew who have been pursuing hurricanes to gather more observations through NASA's Genesis and Rapid Intensification Processes (GRIP) experiment. The scientists tracked and studied several storms in August and September of 2010, as they formed over the Atlantic Ocean and either petered out or grew into much larger hurricanes. They took measurements in, outside, and around the storms using sensor-laden airplanes and four NASA satellites watching from space. “GRIP’s mission is to understand the physical processes happening in a hurricane, but we will also take that information to improve forecasts,” said Michael Goodman, an atmospheric scientist at NASA's Marshall Space Flight Center.
Like Karl, Hurricane Katrina in 2005 was a storm that started out meekly but got bigger, more powerful, and more devastating in a short time. Katrina went from a Category 3 hurricane with 130 mile per hour winds, to a Category 5 monster with 155 mile per hour winds in only nine hours. It became the costliest and one of the deadliest natural disasters to hit the United States, causing damages of up to $81 billion and killing more than 1,800 people. Although a weaker storm than Katrina, Karl did $5.1 billion in damage in the Veracruz, Mexico area and killed 22 people. What was it about Katrina and Karl’s winds, clouds, or environment that made them grow so powerful, so fast? “Forecasting the locations or the track of a storm has improved a lot over the last twenty years,” Goodman said. “But scientists haven’t made a lot of progress in knowing if a storm is going to rapidly intensify.”
Small and chaotic
As it turns out, forecasting a storm’s intensity is a trickier problem to solve. “A storm’s track is an easier problem to figure out,” Braun said. Storms are steered around by the surrounding winds, which in turn are governed by the pattern of trade winds that push the ocean around in the tropics. “Large-scale processes like the trade winds evolve more slowly which makes them, in some ways, more predictable,” Braun said. “To the extent that we are able to observe the large scale winds, we can forecast track pretty readily.”

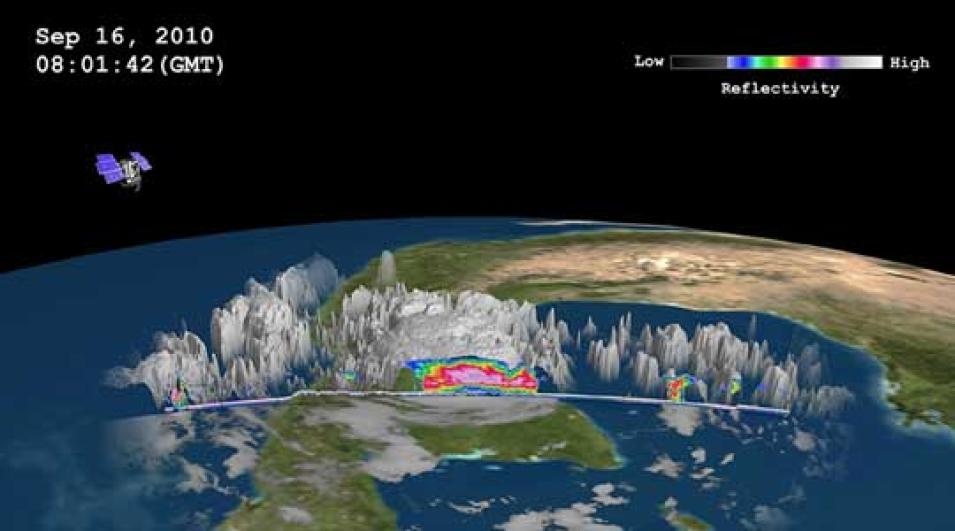
The NASA CloudSat satellite captured a slice of Hurricane Karl’s clouds at 8:01 a.m. GMT (4:01 a.m. EDT) on September 17, 2010. CloudSat shows that the clouds are over eight miles high. The blue areas along the top of the clouds indicate cloud ice. The highest clouds in Karl at the time of the image were as cold as -40 to -60 degrees Celsius (-40 to -76 degrees Fahrenheit). (Courtesy NASA/JPL/Colorado State University/NRL)
In contrast, a storm’s intensity can be influenced by everything, from the individual small cloud all the way up to massive cloud systems. “An individual cloud has the lifetime of maybe thirty minutes to an hour, whereas large-scale events are on the order of twelve to twenty-four hours,” Braun said. “Smaller processes are just so much more chaotic and harder to predict. They are also much less understood by scientists.”
To predict a storm’s intensity, researchers rely on forecast models, as they do in predicting a storm’s track. The model is made of mathematical equations that represent a storm’s elements—like wind speed, temperature, air pressure, humidity—and what is already known about how these elements interact with each other. “The forecast model is only as good as the equations you can create to express how nature works, in addition to the information you give it on the actual state of the atmosphere,” Braun said.
Looking for strange
GRIP scientists want to plug more detailed hurricane observations into their models to improve their forecasts. So they measured as many parts of the hurricane as they could, from the tiny air particles whipped around by the winds, to its enormous cumulonimbus clouds. “By having multiple aircraft with the right array of sensors, we measured several different aspects of the storm simultaneously,” Braun said. “We measured characteristics of the large-scale environment better, but we also measured the evolution of these smaller cloud systems, how they evolved into bigger cloud systems, and hopefully how they were interacting with the environment.” In addition to three aircraft loaded with updated and new instruments, NASA's Terra, Aqua, CloudSat, and Tropical Rainfall Measuring Mission (TRMM) satellites captured the hurricanes’ clouds and rainfall, as well as environmental conditions from space.
Nine months after the field mission and in the midst of processing the large amount of data they collected, the scientists are seeing glimmers of surprising observations that challenge what they thought they already knew about hurricanes. Although still raw and very preliminary, the data are prompting the GRIP scientists to ask new questions. “You don’t often go into the field and come off the airplane and have ‘Eureka!’ moments,” Zipser said. “The most exciting developments in science may happen after you say, ‘Hey, that’s strange.’”

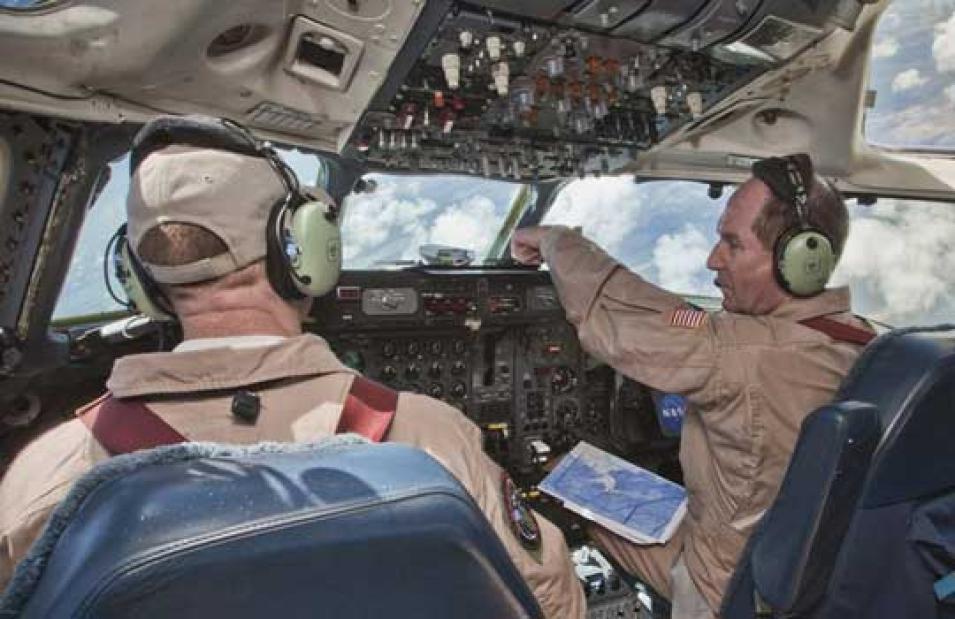
Pilots Shane Dover (left), Bill Brockett (right), and other NASA pilots flew the NASA DC-8 and the Genesis and Rapid Intensification Process (GRIP) scientists on sixteen science flights in just less that two months from their temporary base in Ft. Lauderdale, Florida. The flight crew and scientists also made three deployments from St. Croix, U.S. Virgin Islands to extend their range farther east over the Atlantic Ocean. (Courtesy S. Smith/LaRC)
Challenging hot towers
One of the strange things that Zipser and his colleagues observed in the field and in some of the data is that tall hot towers did not seem to play as big a role in hurricane formation and intensification as they expected. “The conventional wisdom for many years is that you need these intense hot towers for genesis and for rapid intensification,” Zipser said. “Although that still may be true, we are starting to see some evidence that maybe that is not necessary.” Instead, the researchers think that less intense storm clouds may be enough. “Maybe it’s sufficient to have gentle rising towers, as long as the clouds produce a lot of rain, spread fairly evenly around the developing storm center,” Zipser said. “That’s because rainfall is the primary mechanism of releasing heat into the atmosphere acquired from the warm ocean surface.”
Zipser is quick to add a caveat. “This is all still very much up in the air,” he said. “That really is the way of science. These large data analysis efforts take time.” The team is still crunching the data that the project amassed, and NASA's Global Hydrometeorology Resource Center Distributed Active Archive Center (GHRC DAAC) will make the data available to other researchers. Braun said, “At this point, we don’t really understand which of those scales dominates or is most important. But it has given us new ways of looking at things and has helped us redefine our questions, to refocus and clarify them a bit.” Although it may be some time before any of the mission’s findings dramatically improve hurricane intensity forecasting, the scientists are unperturbed. Goodman said, “This is something you want to do properly. You can’t cry wolf when it comes to warning people about hurricanes.”
References
Sippel, J. A., S. A. Braun, and C. Shie.2011. Environmental influences on the strength of Tropical Storm Debby (2006). Journal of the Atmospheric Sciences 2011. doi:10.1175/2011JAS3648.1
Goodman, H. M. et al. 2011. Coordinating aircraft during NASA airborne science field campaigns. Paper presented at the Earth Science Technology Forum, Los Angeles, CA, June 2011.
Zipser, E. J. et al. 2009. The Saharan air layer and the fate of African easterly waves: NASA’s AMMA 2006 field program to study tropical cyclogenesis. Bulletin of the American Meteorology Society 90: 1,137-1,156.
For more information
NASA Global Hydrometeorology Resources Center Distributed Active Archive Center (GHRC DAAC)
NASA Genesis and Rapid Intensification Processes (GRIP) Project
| About the remote sensing data used | |
| Satellites | Terra, Aqua, CloudSat, Tropical Rainfall Measuring Mission (TRMM) |
| Sensor | Various satellite and airborne sensors |
| Data sets | Genesis and Rapid Intensification Processes (GRIP) DC-8 aircraft data Global Hawk aircraft data WB-57 aircraft data |
| DAAC | NASA Global Hydrometeorology Resource Center Distributed Active Archive Center (GHRC DAAC) |
Satellite image in the title graphic shows Hurricane Earl approaching the eastern United States (Courtesy the NASA GOES Project/National Oceanic and Atmospheric Administration)