Dr. Zhong Lu

Data from NASA’s ASF DAAC helps scientists like Dr. Zhong Lu develop satellite radar remote-sensing techniques for studying geohazards.

Dr. Zhong Lu, Shuler-Foscue Professor of Geophysics in the Roy M. Huffington Department of Earth Sciences, Southern Methodist University

Research Interests: The development of satellite radar remote sensing techniques and their application to the study of natural and human-caused geohazards.

Research Highlights: When used in the context of Earth science, the phrase “satellite data” often refers to the optical imagery of Earth’s atmosphere, land, and ocean like that seen in NASA Worldview. Yet, there is another, often less discussed, type of satellite data that have been quietly shaking up the remote sensing community since the 1990s: Synthetic Aperture Radar (SAR).

SAR sensors measure features of the planet’s surface by bouncing microwave signals off Earth. Because it uses much longer wavelengths than instruments like the Operational Land Imager (OLI) aboard the joint NASA/USGS Landsat satellites and the Moderate Resolution Imaging Spectroradiometer (MODIS) aboard NASA’s NASA’s Terra and Aqua satellites, SAR can do things these instruments can’t, such as “see” in the dark and through clouds and rain.

SAR wavelengths (or bands) are designated by a letter, such as C, L, P, and X, and each band has different attributes pertaining to how it interacts with the surface and how far it can penetrate into a given medium. For example, X-band, which has a wavelength of about 3 centimeters (cm) has little capability to penetrate into broadleaf forest, while L-band, which has a wavelength of 15 to 30 cm, can penetrate Earth’s vegetation canopy to reach the ground surface. (Note: you can see a table showing the common uses for each band on the Earthdata website.)

Over the years, scientists working in a range of disciplines have devised a host of clever ways to use SAR to study everything from the hidden settlements of early human civilizations to the minute deformations in Earth's crust that might provide clues about when a volcano might erupt. One of these scientists is Dr. Zhong Lu, the Shuler-Foscue Professor of Geophysics in the Roy M. Huffington Department of Earth Sciences at Southern Methodist University in Dallas, Texas. Lu educates students in the use of SAR and researches the development and use of satellite radar remote sensing techniques in a range of natural and anthropogenic geohazard applications, including volcano deformation, land subsidence, human-induced surface deformation, and landslide monitoring.

In addition to his work as an educator and researcher, Lu is also a member of NASA’s Alaska Satellite Facility Distributed Active Archive Center’s (ASF DAAC) User Working Group (UWG), which represents the user community in the development and operation of the ASF DAAC’s products and services.

The ASF DAAC specializes in the acquisition, processing, archiving, and distribution of SAR data, tools, and resources for NASA’s Earth Observing System Data and Information System (EOSDIS). Its SAR datasets originate from sensors on several satellite missions, including the ESA (European Space Agency) ERS-1 and -2, ENVISAT, and Sentinel-1 satellites; the Japan Aerospace Exploration Agency (JAXA) Japanese Earth Resources Satellite (JERS) and Advanced Land Observing Satellites (ALOS-1 and -2); the Canadian Space Agency's RADARSAT-1 satellite; and NASA’s Soil Moisture Active Passive (SMAP) and Seasat satellites. The ASF DAAC also acquires SAR data from the Spaceborne Imaging Radar-C (SIR-C), which flew aboard NASA’s Space Shuttle Endeavor and was part of NASA’s Airborne SAR (AIRSAR) and Uninhabited Aerial Vehicle SAR (UAVSAR) airborne missions.
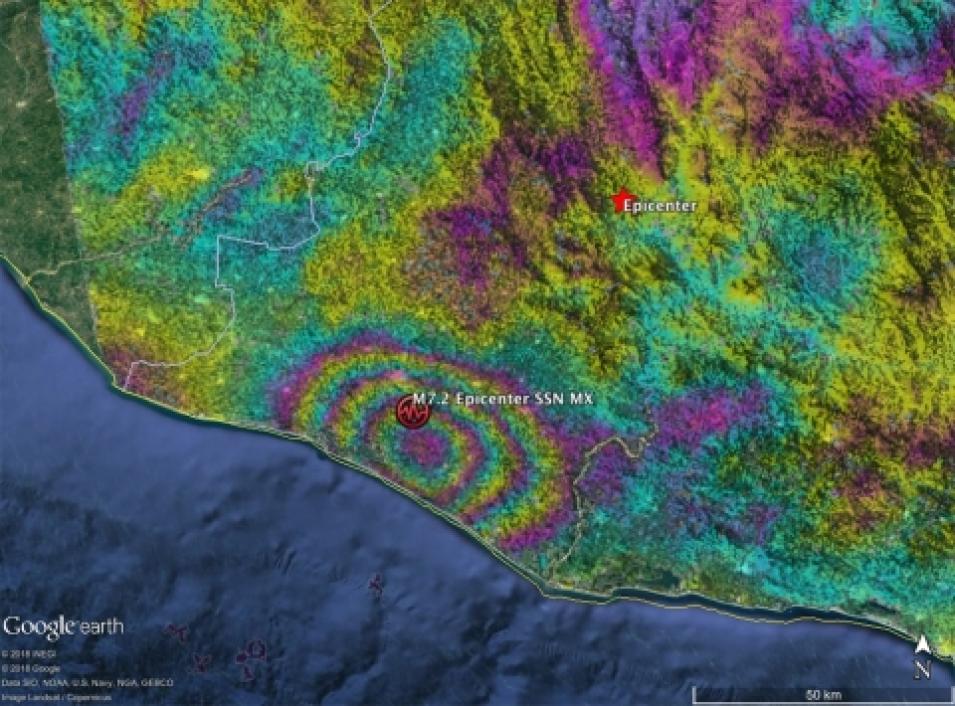
An interferogram of Sentinel-1 data showing the location of an earthquake
Image Caption

This interferogram was created with Sentinel-1 SAR data acquired February 5 and February 17, 2018, and shows an earthquake fault slip on a subduction thrust fault causing as much as 40 cm of uplift on the surface. The motion has been contoured with 9 cm color contours, also known as fringes. Credit: NASA Disasters Program.

The SAR datasets available from the ASF DAAC are not only crucial to the monitoring and analysis of changes in Earth’s surface, they are also key components in interferometry (InSAR), which uses two or more SAR images of the same area acquired at different times to produce a map called an interferogram. If the ground has moved away from (subsidence) or toward (uplift) the satellite between the times images were obtained, the difference in the phases of radar waves will be proportional to displacement on the surface. The resulting map of these displacements, which is called an interferogram, often uses a repeating color scale to indicate the amount of displacement (see image at right).

“NASA Earth science data, particularly the SAR images archived at the ASF DAAC, are the input data for my research,” Lu said. “By applying InSAR processing techniques to SAR images we can produce imagery showing a series of ground motions over time, which we then use to form the foundation for modeling geophysical processes.”

Lu’s SAR research, which he conducts with his university colleagues, graduate students, and a diverse group of other collaborators, has enabled him to study a range of natural and human-caused geohazards in areas both in and outside the continental United States.

“The areas of my research span the U.S. from coast to coast,” said Lu. “In the Aleutian volcanic arc, we monitor volcano deformation and study how volcanoes work. Over the West Coast of the U.S., we identify active slow-moving landslides, most of which are beneath vegetation and therefore difficult to detect using optical remote sensing images. Over the U.S. Gulf Coast, we study the instability of coastal lands caused by the pumping of ground water, the injection of wastewater, and mining activities, among others.”

Lu’s research has also led to several significant discoveries. For example, Lu and his colleagues used approximately 7,000 ALOS-1 and -2 time-series satellite radar images from 2007 to 2019 to map 600 large landslides in the U.S. Pacific Northwest. Of these 600 landslides, less than 5% were accounted for in the USGS Landslide Inventory. Further, this time-series imagery allowed Lu and his team to analyze how these unknown or “hidden” landslides evolved in the wake of precipitation and erosion, seismic activity, wildfires, and other events.

To help share their findings, Lu and his team created an online tool that allows users to visualize the newly identified landslides along with a downloadable version of the data files via the USGS data repository. Lu and his colleagues are hopeful that the information available in this freely accessible inventory can be used by federal and state agencies and local governments in land use planning and hazard management.

“Landslides are a near-constant threat to the safety of communities and infrastructure throughout the Pacific Northwest,” said Lu. “Once an unstable slope gives away, the formed debris flow could travel at a high speed, leaving limited time to evacuate people along the flow path and often leading to devastating consequences. Other landslides that have not evolved into deadly flows yet can still result in significant damage to highways, houses and other structures, and above and belowground infrastructure.”

An interferogram showing the location of landslides in the PNW
Image Caption

This screen capture shows the online tool Lu and his colleagues created to display the hundreds of landslides in the Pacific Northwest detected by an analysis of approximately 7,000 ALOS-1 and -2 time-series satellite radar images from 2007 to 2019. Credit: Dr. Zhong Lu.

Further, this work compliments the findings of a research paper that Lu and his Southern Methodist University colleague Dr. Jinwoo Kim published in the journal Geohazards in 2021. In this paper, Lu and Kim outlined a framework for investigating the link between precipitation and landslide hazards in the Northwestern U.S. that uses InSAR data, precipitation, and soil moisture data from the joint NASA/JAXA Tropical Rainfall Measuring Mission (TRMM) and NASA's Soil Moisture Active Passive (SMAP) satellite missions, and numerical modeling and correlation analysis.

The InSAR time-series observations provided an indication of landslide occurrence and extent, and the precipitation and soil moisture observations from space- and ground-based sensors contributed to the development of hydrogeological models pertaining to water infiltration. After mapping landslides throughout the state of Washington and conducting more detailed analyses at select sites in southern Washington and southwestern Oregon, the researchers found that that their framework contributed to a better understanding of the relationships among hydrologic processes, topographic and geologic settings, and the landslide movements and mechanisms inferred from the InSAR measurements and regional landslide modeling.

In addition to investigating landslides, Lu uses InSAR-derived measurements of surface deformation to inform models of the magmatic processes of the volcanoes in the Aleutian Islands. Lu and his colleague Dr. Dan Dzurisin of the USGS processed nearly 12,000 SAR images acquired by ERS-1 and -2, JERS-1, Radarsat-1, Envisat, ALOS, and TerraSAR-X satellites from the early 1990s to 2010 to identify surface deformation at most of the Aleutian Arc’s Holocene volcanoes. Then they used analytical models to estimate the location, shape, and volume change of the sources of that deformation.

An interferogram showing the inflation of Mt. Peulik volcano in the Aleutian Islands during 1996-1998.
Image Caption

An interferogram showing the inflation of Mt. Peulik volcano in the Aleutian Islands during 1996-1998. One fringe (full color cycle) represents 2.8 cm of range change along the SAR look direction. Areas that lack interferometric coherence are uncolored. Credit: Dr. Zhong Lu.

Lu and Dzurisin found that deformation patterns and associated magma supply mechanisms at Aleutian volcanoes are diverse and vary in both space and time, including in regard to magma accumulation in and withdrawal from crustal magma reservoirs, the pressurization and depressurization of hydrothermal systems, and thermo-elastic contraction of young lava flows. These insights are significant for they, along with information from the geologic record, accounts of historical eruptions, and data from seismology, petrology, gas geochemistry, and other sources, allowed the researchers to develop conceptual models for magma plumbing systems and behaviors of many volcanoes in the Aleutian Arc.

As these findings from Lu’s research suggest, Earth science data from NASA’s ASF and other DAACs are a valuable component to the study of geohazards, both in terms of the measurements they provide and as inputs in the models that help scientists reveal the often difficult-to-detect mechanisms at work in geological processes. Further, the data that make these findings possible are not only a benefit to the scientific community, but to the federal, state, and local agencies tasked with managing geohazards as well.

Best of all, perhaps, is that these benefits will continue with the forthcoming launch of the NASA/Indian Space Research Organization (ISRO) SAR (NISAR) mission, the first satellite mission to collect radar data in two microwave bandwidths (L- and S-band) to measure changes in the planet's surface. These measurements will allow scientists to observe a wide range of Earth processes, from the flow rates of glaciers and ice sheets to the dynamics of earthquakes and volcanoes.

“With the dedicated U.S. and Indian InSAR mission, NISAR, studying geohazards will enter a new era,” said Lu.

Representative Data Products Used or Created:

Available through ASF DAAC:

*NASA’s provision of the complete ESA Sentinel-1 synthetic aperture radar (SAR) data archive through the ASF DAAC is by agreement between the U.S. State Department and the European Commission. Content on ASF’s Sentinel web pages is adapted from the ESA Sentinel-1 website.

Other data products used:

  • TRMM Multi-satellite Precipitation Analysis Rainfall Estimate L3 3-hour, NASA Goddard Earth Sciences Data and Information Services Center (GES DISC) doi:10.5067/TRMM/TMPA/3H/7

Read about the Research:

Lu, Z., & Kim, J.W. (2021). A Framework for Studying Hydrology-Driven Landslide Hazards in Northwestern US Using Satellite InSAR, Precipitation and Soil Moisture Observations: Early Results and Future Directions. GeoHazards, 2:17–40. doi:10.3390/geohazards2020002

Qu, F.F., Lu, Z., Zhang, Q., Bawden, G.W., Kim, J.W., Zhao, C.Y., & Qu, W. (2015). Mapping ground deformation over Houston-Galveston, Texas using Multi-temporal InSAR. Remote Sensing of Environment, 169: 290-306. doi.10.1016/j.rse.2015.08.027

Lu, Z., & Dzurisin, D. (2014). “InSAR Imaging of Aleutian Volcanoes: Monitoring a Volcanic Arc from Space." Springer Praxis Books, Geophysical Sciences, ISBN 978-3-642-00347-9, Springer, 390 pp. http://link.springer.com/book/10.1007%2F978-3-642-00348-6

Explore more Data User Profiles

Details

Last Updated

Data Center/Project

Alaska Satellite Facility DAAC (ASF DAAC)