Background
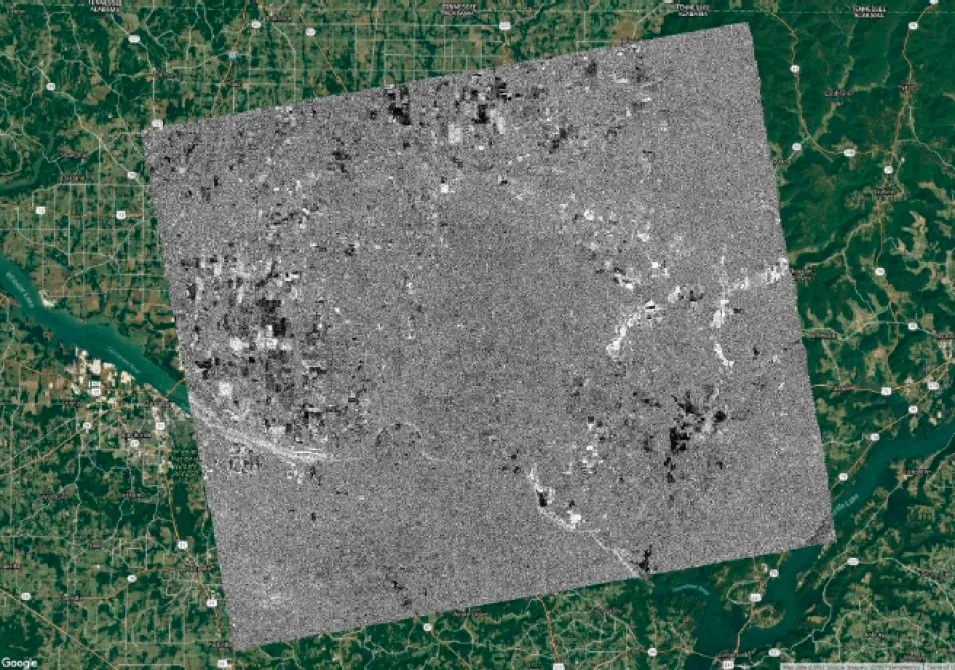
Due to their 24/7 observation capabilities, SAR data are relevant for a broad range of applications in environmental monitoring and emergency response. However, identifying changes in images with complex content is difficult, as the image content masks signatures of change. A simple and highly effective change detection approach is the so-called log-ratio scaling method. Based on a differential analysis of repeated images it has been shown to be effective in background suppression and change features enhancement.
Prerequisites
Materials list
- Windows, Mac, or Linux PC
- Two RTC images
Options to obtain images:
- Download and unzip Sample 1 and Sample 2
- Download and unzip RTC ALOS PALSAR images using Vertex
- Process RTC images using Sentinel data
- QGIS (version 2.18.12 was used in this recipe)
Note: To identify RTC images suitable for change detection, ensure images are from the same season. This is important for change detection operations as it avoids seasonal changes and focuses on true environmental changes in a change detection analysis.
Steps
Load Data
- Open QGIS
- Import two RTC images into QGIS
- Click on the Add Raster icon to open your image
- Browse to the directory of your RTC images
- Select the polarization of your choosing (e.g., HH)
- Select multiple images by holding the Ctrl or Shift button on your keyboard and clicking OK
Calculate the Log-Ratio Image
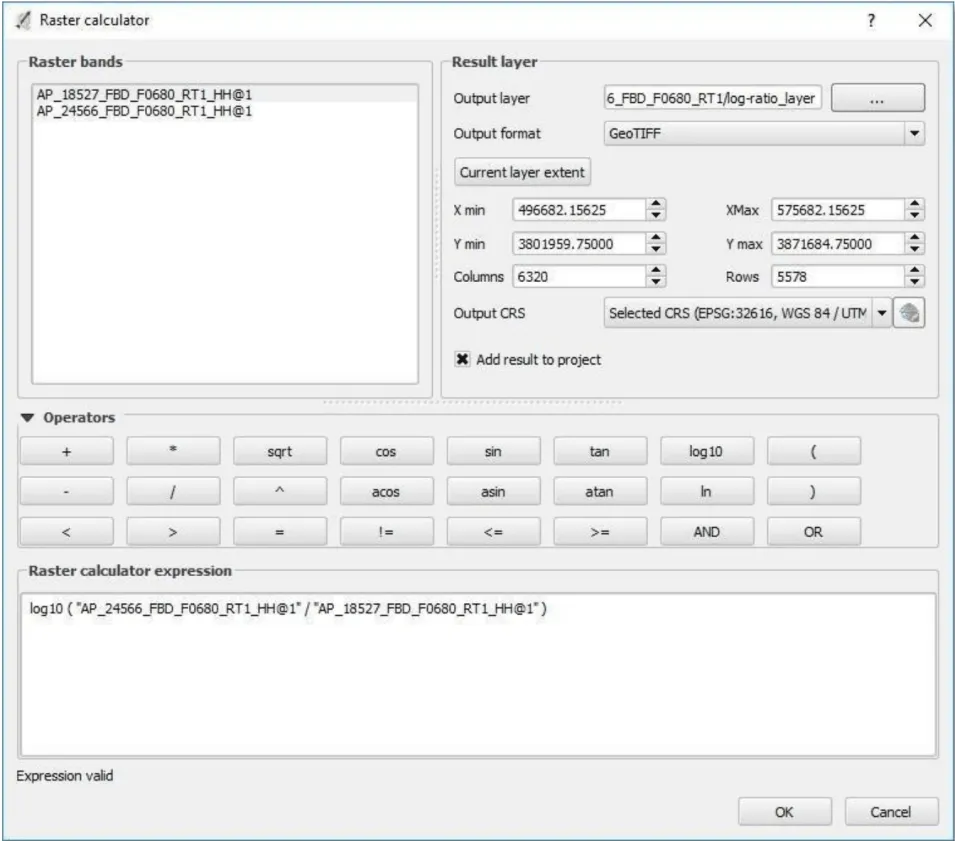
- Open the Raster Calculator
- In the top menu, navigate to Raster > Raster Calculator
- Construct the following expression: Log10 (“newer image”/”older image”)
Note: The newer image has a larger orbit number; e.g., 24566 is newer than 18527. Double-click on the filename to add to the expression.


