Description
Sea ice is the central player in a dynamic system that affects the planet’s oceans and climate. Sea ice is also a force to be reckoned with as polar waters open to human activity, such as shipping that is already taking place through the Northern Route along the coast of Russia and is potentially slated for the fabled Northwest Passage along the coast of Canada. Sea-ice motion, revealed in the data available here, is a critical factor in the thinning and melting of Arctic sea ice as it forms, rafts, ridges, and opens into leads and polynyas — and as winds and currents move it through and out of the Arctic.
The sea-ice imagery and data products available through the ASF DAAC are supported under NASA’s Making Earth Science Data Records for Use in Research Environments (MEaSUREs) program.
Sea Ice Measures Overview
Sea ice is the central player in a dynamic system that affects the planet’s oceans and climate. Sea ice is also a force to be reckoned with as polar waters open to human activity, such as shipping that is already taking place through the Northern Route along the coast of Russia and is potentially slated for the fabled Northwest Passage along the coast of Canada. Sea-ice motion, revealed in the data available here, is a critical factor in the thinning and melting of Arctic sea ice as it forms, rafts, ridges, and opens into leads and polynyas — and as winds and currents move it through and out of the Arctic.
Dramatic changes: Though the extent of sea ice fluctuates, overall it is shrinking and substantially thinner than in past decades, and in spring and summer it is retreating earlier and faster. The melting, along with the absorption of solar energy by newly exposed, darker water, alters the circulations of oceans and the atmosphere, affecting climate and weather globally.
Observable through remote sensing: Remote sensing has been central to observing and researching changes in sea ice. Synthetic aperture radar (SAR), used to create the majority of the imagery available in the ASF archive, is among the power tools of remote sensing and has been used extensively in the science of sea ice. SAR bounces a microwave radar signal off the Earth’s surface, including water and ice, to detect physical properties. Unlike optical technology, SAR can “see” through darkness, clouds, and rain.
Critical for seafood: Sea ice also plays a substantial role in feeding the world. The ice serves as a farm for tiny organisms that drive the entire ecosystem. Seasonal sea ice in the Bering Sea is an integral part of an international fishery that provides more than half of the U.S. seafood catch. In addition, sea ice provides wildlife nurseries, molting sites, dens, hiding places, feeding grounds, resting platforms, and even transportation for Pacific walruses that migrate by riding on melting ice floes.
Sea-ice data, images, and data products available through the Alaska Satellite Facility (ASF) are supported under NASA’s Making Earth System data records for Use in Research Environments (MEaSUREs) program.
Sea Ice MEaSUREs products
Sea-ice imagery and data products are supported under NASA’s Making Earth System data records for Use in Research Environments program. These data have been used in a variety of applications.
Arctic and Southern Ocean imagery, data, and data products available at no cost from the ASF DAAC include:
- More than 11 years of RADARSAT-1, nearly uninterrupted, three-day radar snapshots of Arctic and Southern Ocean sea ice.
- Original synthetic aperture radar (SAR) images.
RADARSAT-1 data have been processed to:
- Construct a near-decadal record of small-scale ice motion of the Arctic and Southern Oceans.
- Produce a record of ice motion of the northern Bering Sea.
- Assemble monthly high-resolution image mosaics of the Arctic Ocean.
These datasets are available from the ASF DAAC and NASA’s Jet Propulsion Laboratory (JPL) through the project’s principal investigator, Ron Kwok. The original RADARSAT-1 images used to generate the products are available for download at no cost from the Alaska Satellite Facility datapool. Through ASF’s datapool, products such as Seasat, RADARSAT-1, ERS-1, ERS-2, JERS, and PALSAR sea ice images are free to approved users. To become an approved user, please submit the required Research Agreement. Additional sea ice data is offered through Polar Year 07-08, a part of the Global Inter-agency International Polar-Snapshot Year (GIIPSY), which contains satellite snapshots of polar regions.
MEaSUREs supports the NASA Earth-science research community in providing Earth science data products and services driven by NASA’s Earth-science goals. MEaSUREs projects focus on the creation of Earth System Data Records (ESDRs), including Climate Data Records. An ESDR is a unified and coherent set of observations of a given parameter of the Earth system that is optimized to meet specific requirements in addressing science questions.
These records are critical to understanding Earth system processes, assessing variability, long-term trends, and changes in the Earth system, and providing input and validation means for modeling efforts.
Explanation of the Data Product Terms
Lagrangian
The Lagrangian sea-ice data products contain monthly measurements of dynamic and kinematic parameters over the Arctic Ocean sea-ice cover. “Lagrangian” is a mathematical way to study ice dynamics by noting changes in position and velocity of points over time. The sea-ice analysis in the dataset available here is initialized by laying a 10km-by-10km grid over a set of RADARSAT images of the sea ice during an initial 3-day period of a season. The grid forms cells for which several properties can be derived that describe the sea-ice dynamics. The grid points of the sea ice and related cell properties are then tracked throughout the season.
Four data products result from these measurements:
1) Ice Motion – a record of the time and location of each point within the initial grid as tracked on RADARSAT images at approximately 3-day intervals. Note that a small fraction of the points may be lost during the season through advection out of the Arctic basin, loss of ice, or untrackability of the ice cover.
2) Deformation – a record of each cell’s divergence, vorticity, and shear. As the vertices of each cell move within a time step, the kinematic properties can be calculated to characterize the response of the ice cover to stresses induced by wind and ocean currents.
3) Ice Age and Thickness – a record of the area, age, and thickness of new and ridged ice resulting from cell area changes. A spatial and temporal distribution of these ice areas is kept for each cell. If the area of a cell increases within a time step, an area of new ice is created. The ice thickness within all the new ice areas created during the season is increased using air temperature information. The thinnest ice areas are rafted or ridged when the cell area decreases, depending on their thickness. The thickness of areas of ridged ice also grows over time.
4) Backscatter Histogram – a record of the radiometric properties of the ice within each cell. A histogram of the radar brightness is kept within each cell at each time step, allowing the user to deduce multi-year ice fractions of the ice cover.
Note that in earlier winter products, we use a 10km-resolution grid over the existing ice cover, beginning sometime near the beginning of November. In later products, we used a hybrid grid of 10km resolution over the multi-year ice pack and a 20km grid over the seasonal ice. We began our analysis in early December to permit the tracking of the seasonal ice regions.
3-Day Gridded
The 3-day gridded datasets are produced from the Lagrangian products. Parameters from the Lagrangian dataset are processed to produce fields with constant grid spacing. The gridded parameters are ice age, ice thickness, backscatter histogram, divergence, vorticity, and shear. Data values cover a 3-day period on a 12.5km-x-12.5-km grid. Each of the downloadable files contains one month of these 3-day product files.
Melt Onset
The melt onset product consists of a gridded field containing the date of surface melt at each grid location. This date is derived from changes in the radar backscatter signature within the Lagrangian cells between April and June. The grid is at 10km resolution within the interior of the Arctic basin and 25km resolution near the coasts.
Eulerian
Maps:
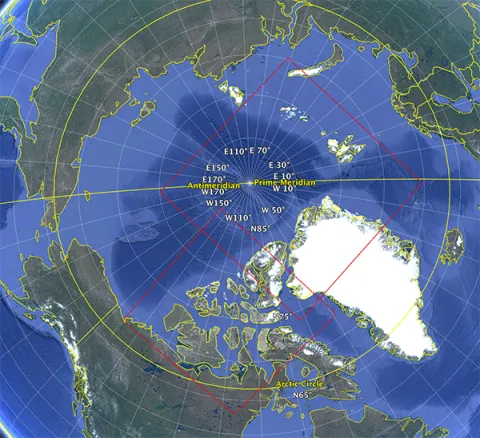
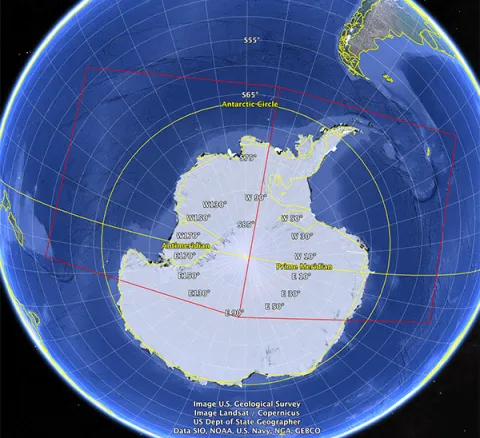
Between 2008 and 2012, an archive of Envisat SAR imagery of the Arctic and Southern Oceans was created. In a project, conducted by Senior Research Scientist Ron Kwok of the Jet Propulsion Laboratory, the SAR imagery from Envisat was used to produce a high-resolution dataset of small-scale sea ice kinematics and deformation. This work is supported under NASA’s Making Earth System Data Records for Use in Research Environments (MEaSUREs) program. The motion field is sampled in Eulerian mode. The objectives are to:
- Process the Envisat data stream to construct ESDRs of small-scale ice motion of the Arctic and Southern Oceans;
- Develop products that take advantage of the temporal (daily observations) and spatial sampling scheme of the Envisat mission;
- Produce mosaics of the Envisat images of the Arctic Ocean and Southern Ocean.
Product Summary

Citation
Citation is critically important for dataset documentation and discovery. This dataset is openly shared, without restriction, in accordance with the EOSDIS Data Use Policy.
Data Center Citation
Cite datasets in publications such as journal papers, articles, presentations, posters, and websites. Each Sea Ice MEaSUREs dataset has an assigned DOI. Please send copies of, or links to, published works citing data, imagery, or tools accessed through ASF to uso@asf.alaska.edu with “New Publication” on subject line.
| Format | Example | |
|---|---|---|
| [Last name, first initial of principal investigator if appropriate*], RADARSAT-1 data [year of data acquisition] (CSA). Dataset: [name of dataset]. Retrieved from ASF DAAC [add URL if print publication: asf.alaska.edu], [day month year of data access]. DOI: [doi]. | Kwok, R., RADARSAT-1 data 1997 (CSA). Dataset: Lagrangian Sea-Ice Kinematics. Retrieved from ASF DAAC 7 December 2014. DOI: 10.5067/SSMPINYI15UU. | |
| *Kwok, R., is the principal investigator on all three Sea Ice MEaSUREs datasets. |
Citing Sea Ice MEaSUREs Imagery
Include appropriate credit with each image shown in publications such as journal papers, articles, presentations, posters, and websites.
| Type | Format | Example |
|---|---|---|
| Imagery, primary or altered | © CSA data [year of data acquisition]. | © CSA data 2014. |
| Imagery, derivative | © Kwok, R., [year of image creation], contains CSA data [year of data acquisition]. | © Kwok, R., 2012, contains CSA data 1997. |
Maps


