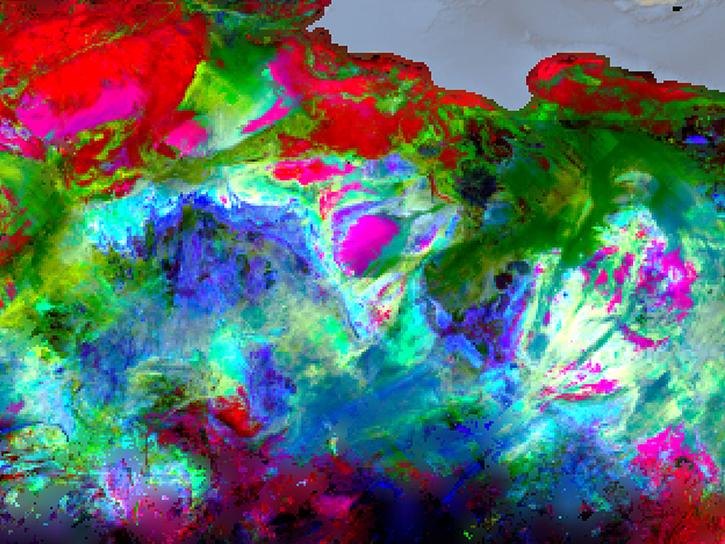
Access a range of datasets and data tools to further your reflectance research.
Reflectance is the amount of light reflected back into space. Light colored surfaces, such as ground covered with fresh white snow, reflect a high amount of light striking them and appear bright in satellite imagery. Dark or rough surfaces, such as dense forests or dark volcanic rock, reflect far less light and appear darker in imagery. Reflectance data can be collected not just for Earth’s surface, but also for clouds and the atmosphere itself.
Reflectance data are useful when comparing multiple images for the same region to detect and characterize changes to Earth’s surface and atmosphere. As pollutants or aerosols like dust spread over an area, they can change the surface reflectance detected by sensors aboard orbiting satellites. Reflectance data are not only used for visualizing Earth’s surface and atmosphere, but also for computing metrics and creating models that are useful for specific analysis.
NASA’s stores of Earth data include several global reflectance products, including land surface reflectance, top of atmosphere reflectance, and cloud measurements. These can be used for studies of phenomena such as pollution and greenhouse gases, aerosols, glacier shrinkage, and land cover change.
Learn How to Use Reflectance Data
Join Our Community of NASA Data Users
While NASA data are openly available without restriction, an Earthdata Login is required to download data and to use some tools with full functionality.
Learn About the Benefits of Earthdata LoginFrequently Asked Questions
Earthdata Forum
Our online forum provides a space for users to browse thousands of FAQs about research needs, data, and data applications. You can also submit new questions for our experts to answer.
Submit Questions to Earthdata Forumand View Expert Responses