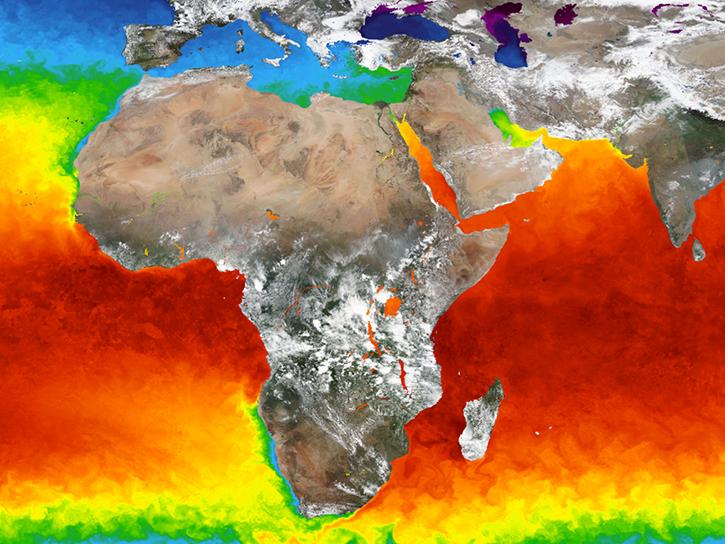
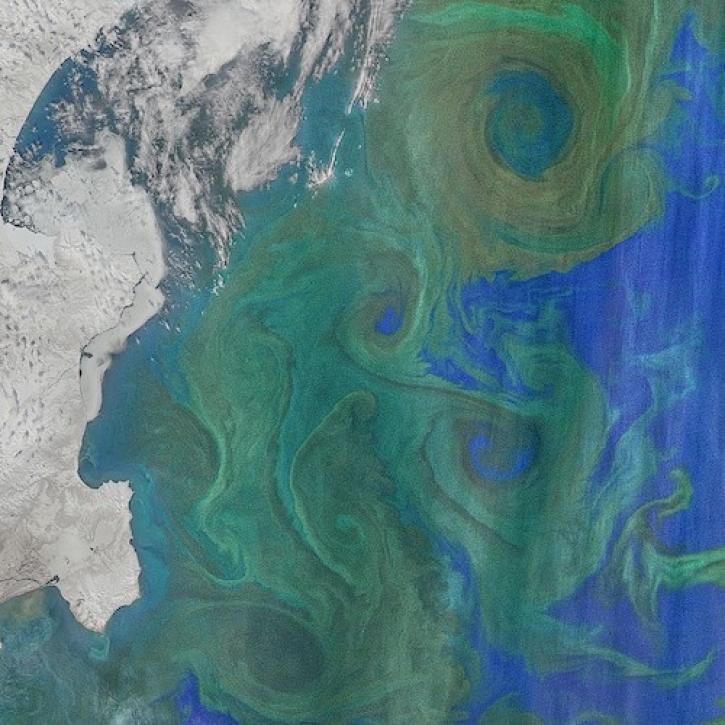
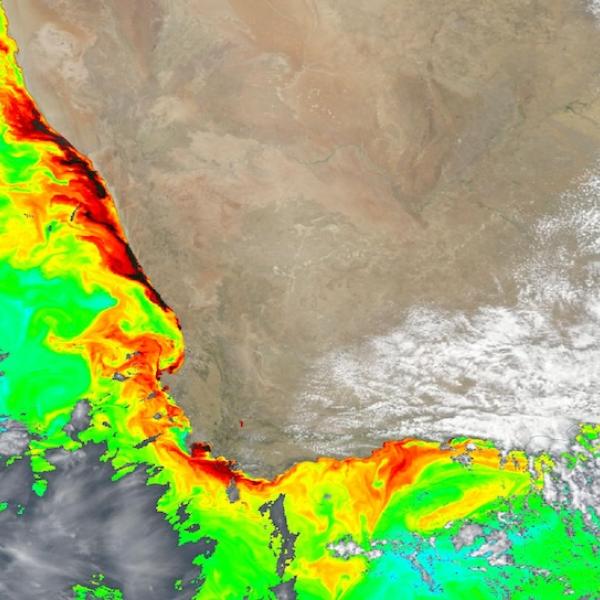
Access a range of datasets and data tools to further your chlorophyll research.
Chlorophyll is the substance in plants that colors them green. It’s also what makes plants able to use energy from the sun to convert carbon dioxide and water into glucose and oxygen in the process called photosynthesis. The ubiquity of plants containing chlorophyll across the natural world means that measuring their levels across forests, fields, oceans and other areas can reveal important things about the characteristics and health of ecosystems.
NASA has many platforms and instruments for calculating chlorophyll levels and other related measurements various biomes. For research within the biosphere, NASA’s Moderate Resolution Imaging Spectroradiometer (MODIS) can detect the sunlight reflected by chlorophyll to estimate the “greenness” and presence of vegetation across an area. MODIS and other data are also valuable for studying chlorophyll as it relates to terrestrial water quality and significant events, such as harmful algal blooms. Over the ocean, the Ocean Color Instrument (OCI) detects the chlorophyll light signal from plankton to measure their concentrations and infer other details about the sea surface environment.
Learn more by exploring our various chlorophyll-related articles, tools, and datasets.
Learn How to Use Chlorophyll Data


Join Our Community of NASA Data Users
While NASA data are openly available without restriction, an Earthdata Login is required to download data and to use some tools with full functionality.
Learn About the Benefits of Earthdata LoginFrequently Asked Questions
Earthdata Forum
Our online forum provides a space for users to browse thousands of FAQs about research needs, data, and data applications. You can also submit new questions for our experts to answer.
Submit Questions to Earthdata Forumand View Expert Responses