NASA Earth Science Data Roundup: November 2023
All CSA (Canadian Space Agency) RADARSAT-1 data archived at NASA's ASF DAAC can be freely downloaded. Anyone who has registered with NASA Earthdata Login and agreed to the ASF End User License Agreement (EULA) can access and download these data.
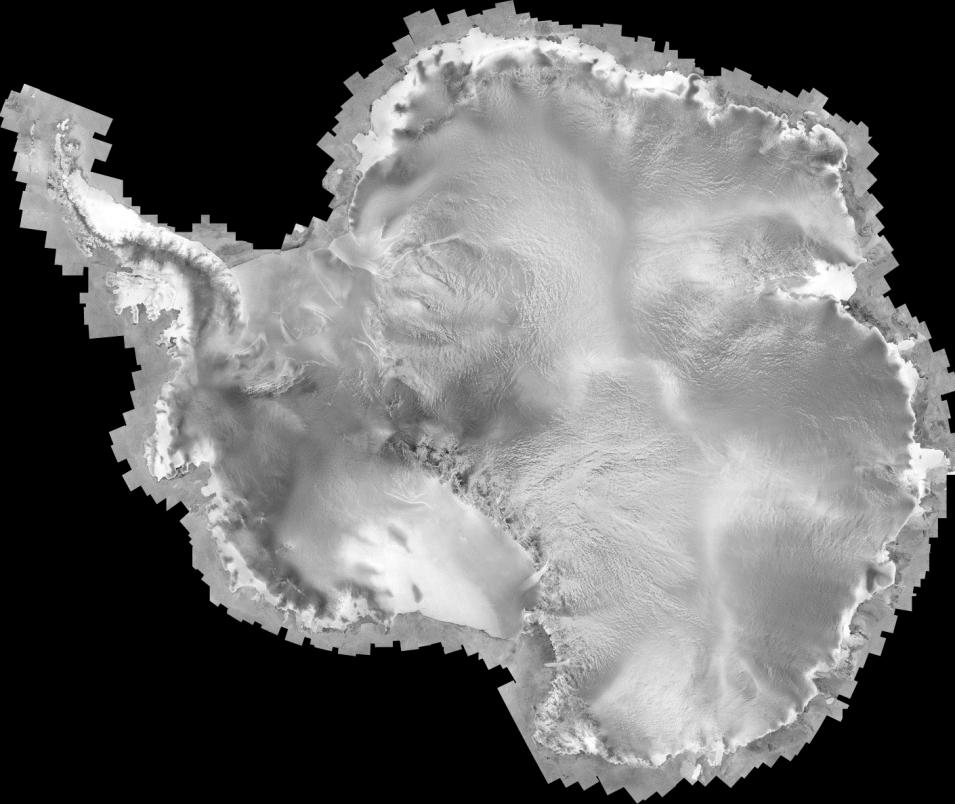
RADARSAT-1, which launched in 1995 and ceased operation in 2013, proved data for monitoring sea ice and terrestrial ice sheets, facilitating climate research, identifying and mapping land features, and assessing environmental change over time. Data from the satellite were also used to compile the first high-resolution map of Antarctica.
Sentinel-1 Data File Size Increases
As a result of the transition made by ESA (European Space Agency) to its new Copernicus Data Space Ecosystem, Sentinel-1 data files are no longer compressed. Therefore, all Sentinel-1 data files available through NASA's ASF DAAC since September 26, 2023, are larger by as much as 60%. As a consequence of these larger file sizes, some files will take longer to download. Depending on the quality of users’ internet connections, this may result in incomplete file transfers if the download connection times-out before the transfer is complete. ESA is aware of this issue and hopes to have a solution by the end of this year. In the meantime, ASF is exploring options it can implement until a permanent solution is in place.
Atmospheric Science Data Center (ASDC)
ASDC Releases POLARIS Campaign Data
NASA’s ASDC released data for the Photochemistry of Ozone Loss in the Arctic Region in Summer (POLARIS) campaign, which took place April through September 1997. The goal of this joint NASA and NOAA effort was to gain a better understanding of the changes of stratospheric ozone levels from very high concentrations in the spring to very low concentrations in the autumn. The NASA ER-2 aircraft was the primary platform, along with balloons, satellites, and ground sensors. Flights occurred over Fairbanks, Alaska, with some flights conducted over California and Hawai'i. Observations were used to constrain stratospheric computer models to evaluate ozone changes due to chemistry and transport. Nine collections ranging from in-situ to model data are available through Earthdata Search and ASDC's Direct Data Download.
Data access and more information
New CALIPSO Mission Version 4.51 Data Products Released
Two new Imaging Infrared Radiometer (IIR) Level 2 products from the Cloud Aerosol Lidar and Infrared Pathfinder Satellite Observation (CALIPSO) mission—the V4.51 IIR Level 2 standard track dataset and the V4.51 IIR Level 2 standard swath dataset—are available through NASA's ASDC. The standard track product contains emissivity and cloud particle data related to pixels co-located to the lidar track. The version of this product was changed to V4.51 to account for a change in the operating system of the CALIPSO production cluster. The standard swath product contains emissivity and cloud particle data assigned to IIR pixels on a 1 km grid centered on the lidar track. Both of these products use the recently released V4.51 Cloud-Aerosol Lidar with Orthogonal Polarization (CALIOP) Level 2-layer products as inputs.
Data access and more information
Goddard Earth Sciences Data and Information Services Center (GES DISC)
Suomi NPP Cross Track Infrared Sounder Megacities Collections from the TROPESS Project
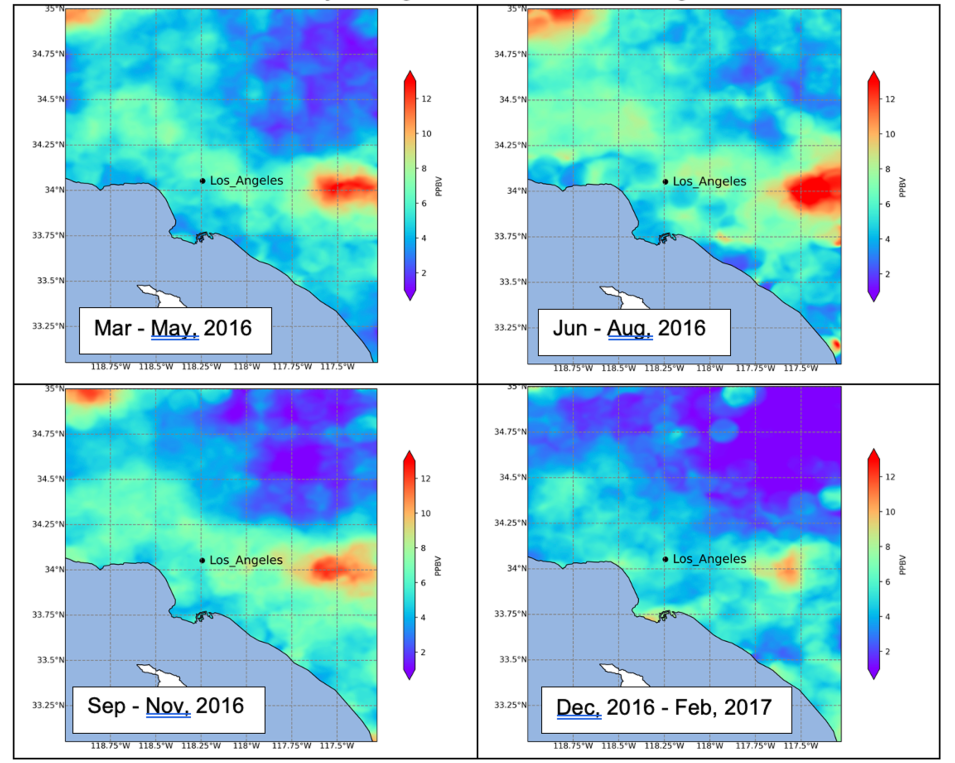
TROPESS ammonia concentrations show the seasonal variability over southern California (lower values in winter, higher values in summer), as well as the spatial variability across the region. The spatial variability is driven mainly by source location, while the temporal variability is due to changes in temperature (emission decrease with decreasing temperature) and in atmospheric conditions (such as inversions and wind patterns). Credit: NASA’s GES DISC.
NASA’s GES DISC released the Suomi National Polar-orbiting Partnership (Suomi NPP) satellite Cross Track Infrared Sounder (CrIS) Megacities data product collection from the TRopospheric Ozone and Precursors from Earth System Sounding (TROPESS) project.
These products contain the vertical distribution of seven retrieved atmospheric gases (methane, carbon monoxide, water vapor, semi-heavy water, ammonia, ozone, peroxyacetyl nitrate) and temperature, along with their estimated uncertainties. These products are part of the TROPESS Special Collections centered on select regions over the cities of Beijing, China; Tokyo, Japan; Delhi, India; Karachi, Pakistan; Lagos, Nigeria; Mexico City, Mexico; Los Angeles, California; and Sao Paulo, Brazil.
Data access and more information
Land Processes Distributed Active Archive Center (LP DAAC)
NASA MEaSUREs Low Earth Orbit Land Surface Temperature Monthly Global Gridded V2 Data Product Now Available
The Making Earth System Data Records for Use in Research Environments (MEaSUREs) Low Earth Orbit (LEO) Land Surface Temperature (LST) Monthly Global Gridded Version 2 data product provides LST measurements derived from data acquired by the Moderate Resolution Imaging Spectroradiometer (MODIS) and Visible Infrared Imaging Radiometer Suite (VIIRS) instruments, as well as LST error estimates for both day and night. The data are provided in 0.25, 0.5, and 1 degree optimized climate grids and can be used to develop approaches to study monthly global temperatures.
Data Access and more information
Level 1 and Atmosphere Archive and Distribution System Distributed Active Archive Center (LAADS DAAC)
All LAADS DAAC Historical Data Now in the Cloud
NASA’s LAADS DAAC completed the migration of all historical satellite-derived data collections to the Earthdata Cloud, and these cloud-based data can be accessed using NASA's Earthdata Search tool. Users can filter searches by selecting LAADS DAAC under “Organization” and “Available in Earthdata Cloud” under “Features.” LAADS DAAC cloud-based datasets can only be accessed in the cloud from the US-West-2 region, and the DAAC does not yet provide any cloud-based data services. All data collections are available in their native format for each sensor—HDF4 for MODIS data and HDF4, HDF5, and NetCDF4 for VIIRS data.
National Snow and Ice Data Center Distributed Active Archive Center (NSIDC DAAC)
This color-coded map shows a multiyear ice velocity mosaic for the Greenland Ice Sheet superimposed on topographic coastal features. Highest ice velocities appear in magenta, intermediate velocities appear in blue and green, and lowest velocities appear in yellow. Credit: NASA MEaSUREs Greenland Ice Mapping Project (GrIMP) using German Aerospace Center, ESA, USGS, JAXA (Japan Aerospace Exploration Agency), and CSA data.
MEaSUREs Greenland Image Mosaics and 6- and 12-Day Ice Sheet Velocity Mosaics Now Available
NASA’s NSIDC DAAC updated the MEaSUREs Greenland Image Mosaics from Sentinel-1A and -1B, Version 4 and MEaSUREs Greenland 6- and 12-Day Ice Sheet Velocity Mosaics from SAR, Version 2 datasets. The temporal coverage of both the image mosaics and 6- and 12-day velocity mosaics data now spans from January 1, 2015, to July 23, 2023.
Data access and more information
ATLAS/ICESat-2 L1B Converted Telemetry Data (ATL02), Version 5 Retiring
The Advanced Topographic Laser Altimeter System (ATLAS)/Ice, Cloud, and Land Elevation Satellite-2 (ICESat-2) Level 1B Converted Telemetry Data (ATL02), Version 5 dataset will be retired from the NSIDC DACC archive on November 13, 2023. After this date, access to the data will no longer be available, but the dataset documentation will remain available for future reference. NSIDC DAAC staff recommend using Version 6 of the dataset, which was released on May 11, 2023.
Data access and more information
New Feature Added to Receive Data Updates
NSIDC DAAC data users can now subscribe to receive data updates from mission, project, and field investigation collection pages. This new feature makes it easier for users to receive data updates at the mission level (e.g., all ICESat-2 data updates). To access this feature, click on Data Announcements in the right side menu of each data collection page, then click on the Subscribe option at the top of the Data Announcements page.
Physical Oceanography Distributed Active Archive Center (PO.DAAC)
GRACE-FO Level-3 Monthly Land/Ocean Mass Anomaly Datasets Released
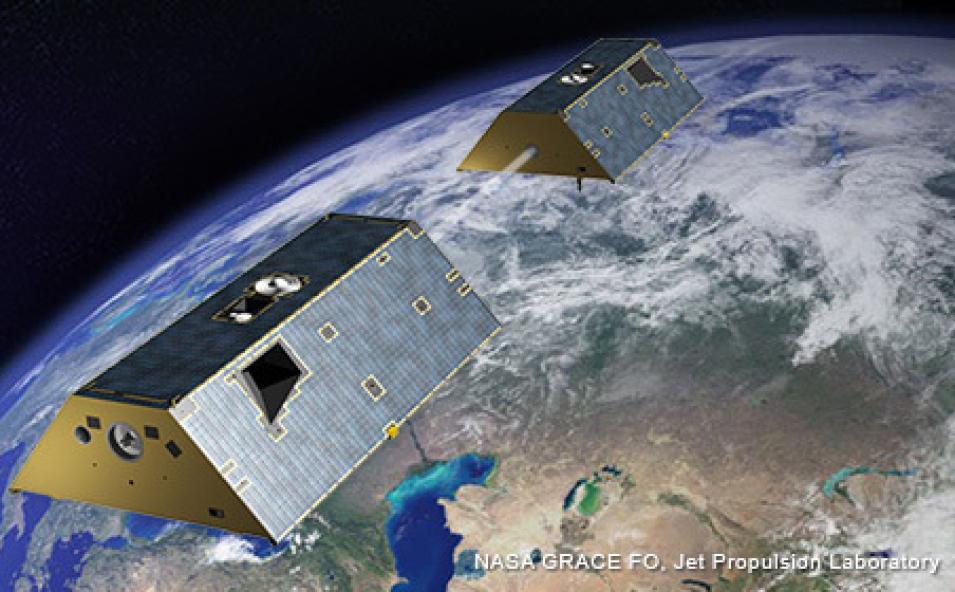
NASA’s PO.DAAC released the Gravity Recovery and Climate Experiment Follow-on (GRACE-FO) Level-3 Monthly Land/Ocean Mass anomaly RL06.2 Version 4 datasets produced by the Center for Space Research (CSR).
The monthly land mass grids contain water mass anomalies given as equivalent water thickness, which represents the total terrestrial water storage anomalies from soil moisture, snow, and surface water (i.e., rivers, lakes, reservoirs, etc.), as well as groundwater and aquifers.
The monthly ocean mass grids contain water mass anomalies given as equivalent water thickness, which represents sea floor pressure changes due to the integral effect of ocean and atmosphere processes, including global mean ocean bottom pressure changes (mean ocean mass and mean atmosphere mass over the global oceans).
The GRACE-FO RL06.2 data product is an updated version of the RL06.1 Level-3 data product with RL06.2 L2 data inputs. The datasets will be updated monthly, assuming no data or operation interruption.
Data access and more information
Socioeconomic Data and Applications Center (SEDAC)
Sustainable Development Goal Indicator 7.1.1: Access to Electricity, 2023 (2020 – 2022) Dataset Released
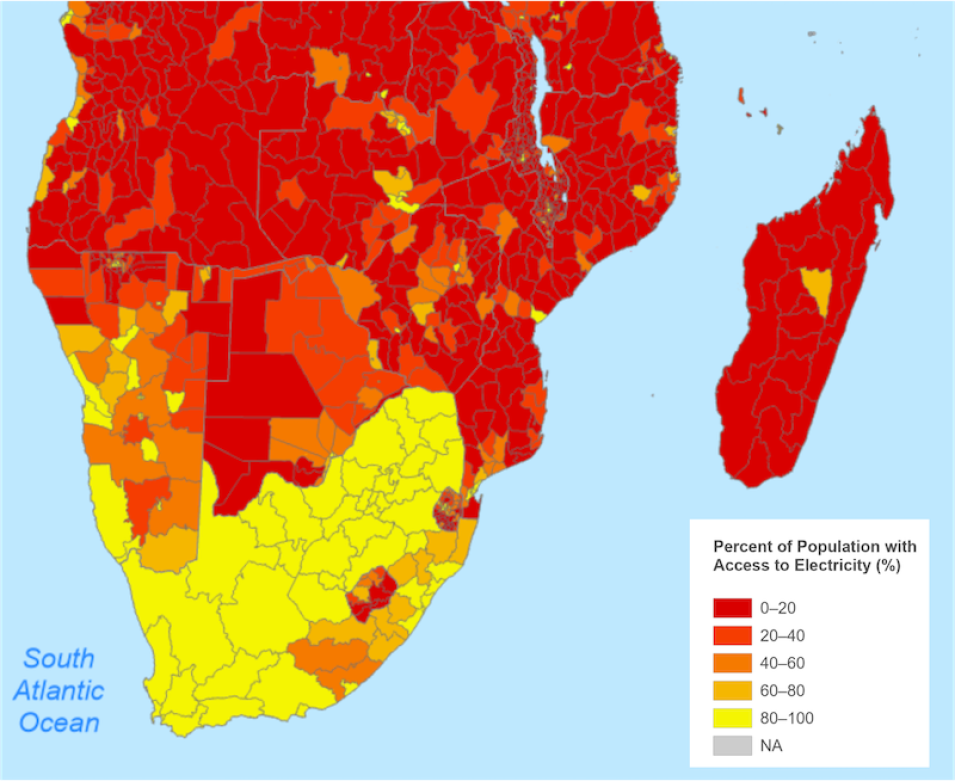
Part of the Sustainable Development Goal Indicators collection, the new Sustainable Development Goal Indicator 7.1.1: Access to Electricity, 2023 (2020 – 2022) Dataset from NASA’s SEDAC measures the proportion of the population with access to electricity for a given statistical area.
Map from the Sustainable Development Goal Indicator 7.1.1: Access to Electricity, 2023 (2020 – 2022) Dataset showing the percentage of population in southern Africa with access to electricity for a given statistical area. Red areas indicate less access; yellow areas indicate higher access. Credit: NASA's SEDAC.
The United Nation’s Sustainable Development Goal 7 (SDG 7) is to “ensure access to affordable, reliable, sustainable, and modern energy for all.” As one measure of progress towards SDG 7, the UN agreed on SDG indicator 7.1.1, which was computed as the proportion of gridded population located within illuminated areas defined by annual VIIRS Nighttime Lights Version 2 (VNL V2) data. The SDG indicator 7.1.1 dataset provides estimates for the proportion of the population in a given area with access to electricity for 206 countries and 45,979 Level 2 subnational units.


