Zika Zone

Knowing a mosquito's terrain may head off a virus.

João Lucas da Silva Araújo lies on a u-shaped nursing pillow next to his year-old, twin sister Ana Vitória. Though the same size as his sister, João acts like a newborn—suckling and clenching his fists with closed eyes. Green tape, a form of physical therapy treatment to relax muscles, circles his mouth and covers the back of each little finger like a green skeleton. His sister prods his face, alert and smiling.

João was the first baby in Brazil believed to be identified with Zika-related microcephaly, a brain defect associated with a small head and brain that causes cognitive and physical disabilities, even death. Once the medical community recognized that the rapidly spreading Zika virus was linked to microcephaly, a global health crisis emerged.

Zika appears to attack fetal brain cells key for brain development, but why one twin was spared highlights how much is not yet understood about transmission. Undeniable, however, is the culprit in Zika’s spread: the mosquito. A group of scientists at the University of Oxford had already followed this villain while pursing dengue fever. Now once more, they gathered in computer labs to offer their support. “When the outbreak was at its peak, we felt it was important to get some maps out,” said Janey Messina, a researcher from the university’s School of Geography and the Environment. The team wanted health officials to be one step ahead by providing them with maps of potential Zika outbreaks.
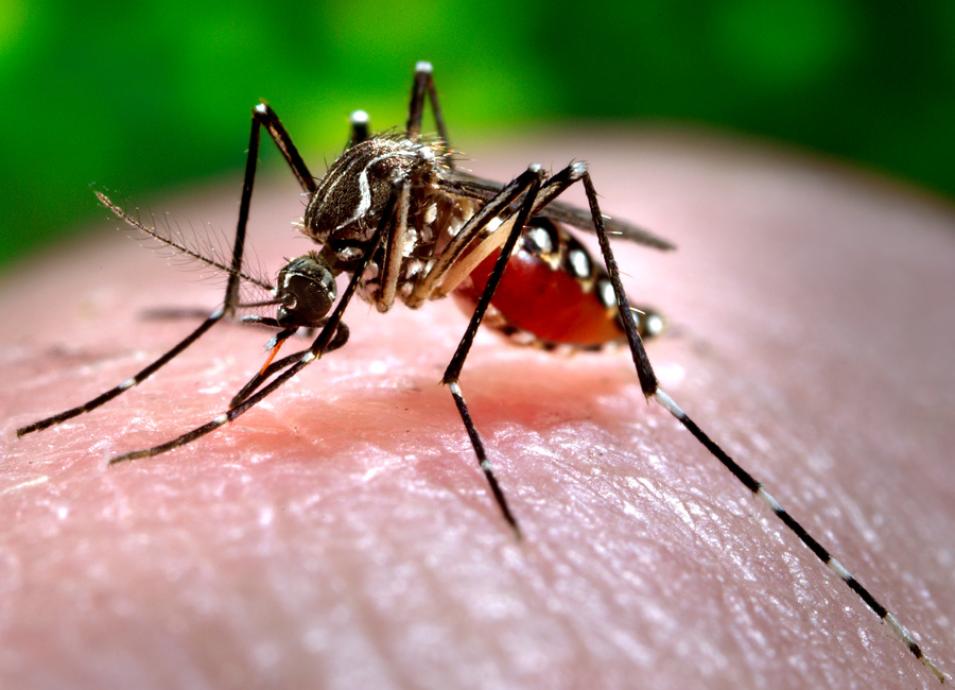
Photograph of a mosquito
Image Caption

This close up of the Aedes aegypti mosquito shows a distended abdomen after feeding. (Courtesy J. Gathany, Centers for Disease Control)

The path of least resistance

To map Zika, the researchers first looked at historical accounts, then at its progression. Zika was not new. It surfaced in 1947 from the depths of the Congo, but its mild symptoms—a rash and low fever—meant scientists largely ignored it. Zika infection was also rare. Only 14 cases had been identified until 2007 when it hit Micronesia in the Pacific. “It burned through the population very quickly because island people live so closely together,” said Moritz Kraemer, then a postdoctoral researcher at Oxford and now a research associate at the Harvard Medical School. Roughly 75 percent of the population of 5,000 was infected. The world, however, paid no attention to the remote island.

In 2013 and 2014 Zika struck another island nation, French Polynesia, where only 20 percent of Zika infections were symptomatic. The next jump landed in the Americas. “Only after it was introduced into the Americas, people started to worry because of its spread,” Kraemer said.

Based on infection rates a viral evolution was suspected. It wasn’t until 2014 that researchers confirmed the mutation that allows for easier transmission, identifying the first Zika transmission to the fetus in French Polynesia. In the following years, the brain malformation affected more than 3,500 Brazilian pregnancies—João being one such case. The hardest hit with microcephaly was the northeastern state of Pernambuco, where rates jumped from five cases per 100,000 births to 300.

As fear of microcephaly swept the world, obstetricians advised against travel to tropical climates, but mere distance proved insufficient. Scientists soon found that Zika could be sexually transmitted, even if infected individuals did not show symptoms, and many did not. All of a sudden, clear boundaries faded, and families everywhere worried where the next case of microcephaly could pop up.

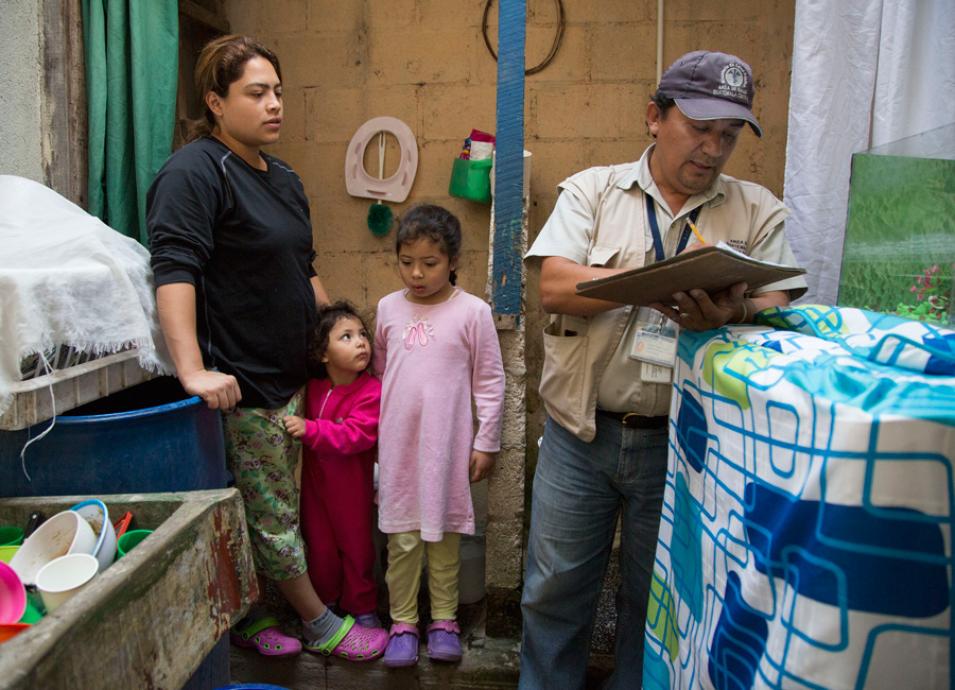
Photograph of a government relief worker checking a family's home in Guatemala
Image Caption

In Guatemala, a governmental relief worker checks this family’s living quarters for potential mosquito breeding. (Courtesy ConredGautemala/Flickr)

The white stripes

But sexual transmission alone does not sustain an outbreak, because the reproductive number is low, meaning not enough people get infected from one case. The most effective transmitter is the mosquito. Both Aedes aegypti and Aedes albopictus can spread the virus, but the former has adapted to urban environments better, preferring to feed on people. “What fascinates me about Zika is that we not only deal with the human-to-human interaction but have an intermediary that becomes very important in controlling the disease,” Kraemer said.

For an outbreak to occur, the mosquito bites an infected person during the first week of infection when the virus swims in a person’s blood. The infected mosquito lives long enough to bite again. This cycle continues multiple times to start an outbreak. Typically, A. aegypti live two to four weeks, but their eggs are viable for more than a year in dry state. Moisture and warmth are needed for the mosquito to re-emerge.

The female A. aegypti, with its white-striped legs and abdomen, bites during the day, digesting blood proteins to lay eggs. It lives in tropical and subtropical regions; it needs high temperatures, ample rainfall, stagnant water for laying eggs, and heavily populated urban environments. “This is what we know from other viruses like dengue,” Kraemer said. Now those factors could be applied to map the potential for Zika. And because there were no Zika data, the researchers really had no other alternative. But Zika and dengue are both flaviviruses, whose genomes share quite a lot of information. “So it’s likely the temperature constraints we used from dengue are quite accurate for Zika as well,” Messina said.

Photograph of workers picking up trash
Image Caption

In the Dominican Republic, workers clean up potential mosquito-breeding containers; Styrofoam is particularly attractive to mosquitos getting ready to lay eggs. (Courtesy PresidenciaRD/Flickr)

Mapping Zika

Once the researchers knew where Zika had been, they could figure out what the environment had in common—urban versus non-urban and temperature, precipitation, and humidity levels—to find similar environments. Moisture is key in egg and larvae development, so the researchers also considered vegetation canopy cover, which reduces evaporation and is associated with higher A. aegypti larvae density. The researchers used an Enhanced Vegetation Index (EVI) calculated from data from NASA's Moderate Resolution Imaging Spectroradiometer (MODIS) to provide a proxy for the level of moisture available given the relationship between precipitation and vegetation growth.

“The main idea is pretty straightforward,” Messina said. “Obviously, the models we run are complex and it’s a lot of data, but at the end we are just trying to understand where this disease might spread to or where it might already be and where we should be on the lookout for a potential outbreak.”

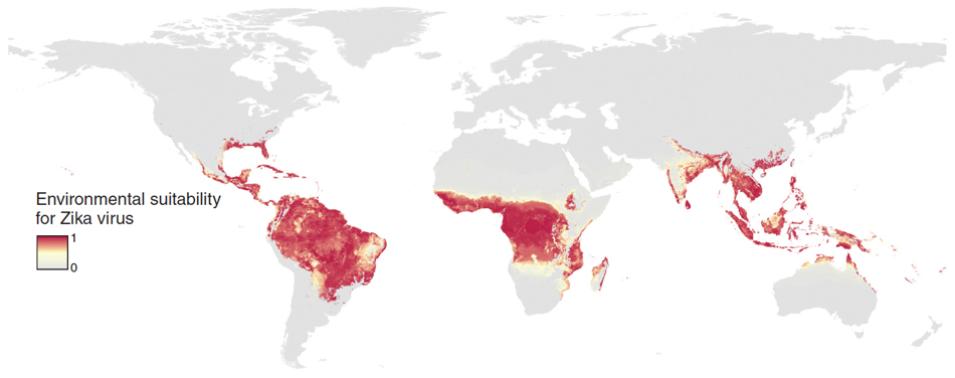
Not surprisingly, in Brazil’s ongoing epidemic, the maps show that the high population areas of northern and southern coastal cities show the highest environmental suitability for Zika. Potential outbreaks stretch into the United States from Texas to Florida. “In addition, there are areas in Asia and central Africa with high suitability but only a few locations reported Zika virus,” Kraemer said. “We would expect given certain travel patterns of people that the disease would arrive there in the future.”

The last step was to identify the populations living in those areas. The researchers essentially built a global map of appropriate environments, and then overlaid each 5-kilometer-square pixel with gridded population data from NASA's Socioeconomic Data and Applications Center (SEDAC), allowing them to line up the environmental data with population.

They then identified certain thresholds with high transmission potential, leading to an estimate that more than two billion people are globally at risk for Zika virus transmission. “It doesn’t mean that all those people will contract Zika,” Messina said. It means that Zika could, however, emerge in these areas. “Outside the research community, maps are powerful tools to communicate to the wider public,” Kraemer said. “Through Google Maps and other mapping products we are now more than ever before exposed to maps in our everyday life.”

Global map showing environmantal suitability for the Zika virus
Image Caption

This map shows global environmental suitability for the Zika virus, ranging from 0 (gray) to 1 (red) with dark red being the optimum environment, white as minimal, and grey as not at all. (Courtesy J. Messina)

Fugitive pieces

The researchers hope these maps will help inform pregnant women and other travelers about possible Zika exposure and let public health officials better target higher-risk communities with an integrated control program, which may include aerial spraying, eliminating mosquito habitats, putting up structural barriers like screens and nets, and educating people about protective clothing and topical repellents like DEET.

Currently, mosquito control is the best method for disease prevention. Vaccines are in the works, with some already through human trials, but it may still take years for them to reach the general public. Efforts are also under way to suppress reproduction by releasing genetically modified male mosquitos to mate with the pest females.

And research continues into microcephaly. Twins may still be the best bet for understanding how Zika attacks the fetus and why some babies escape the disease. Their biological similarities—genetic makeup and fetal environment—allow scientists to identify relevant differences. Identical twins often share the same fate, but fraternal twins in their separate placentas can be quite different, sparing one from Zika—as in the case of João’s sister.

Poverty can also exacerbate Zika. In the favelas, or slums, of Northeast Brazil, Zika found its paradise. Poor sanitary conditions and poor nutrition, leading to weaker immune systems, may explain why these areas were hardest hit with microcephaly.

For now, physical therapy and sensory stimulation may give these babies a fighting chance, sometimes defying developmental barriers detected in their black and white brain scans.

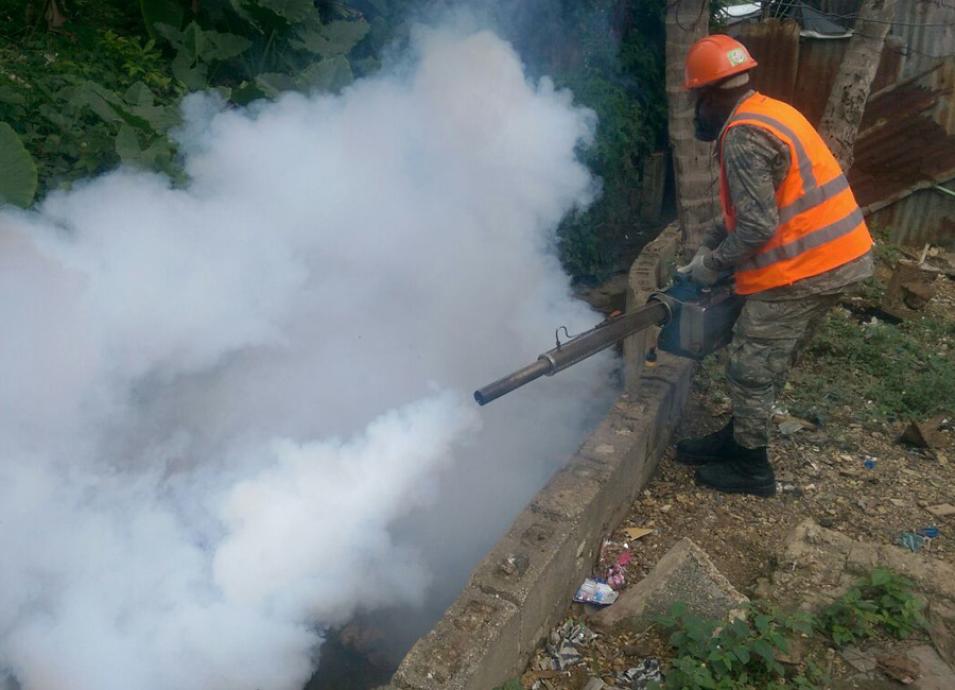
Photograph of a man spraying insecticide
Image Caption

In the Dominican Republic, a man sprays an insecticide to reduce both the adult mosquitoes and their larvae. (Courtesy PresidenciaRD/Flickr)

References

Center for International Earth Science Information Network - CIESIN - Columbia University. 2016. Gridded Population of the World, Version 4 (GPWv4): Population Count. Palisades, NY: NASA Socioeconomic Data and Applications Center (SEDAC). doi:10.7927/H4X63JVC.

Kraemer, M., S. I. Hay, D. M. Pigott, D. L. Smith, G. R. Wint, and N. Golding. 2016. Progress and challenges in infectious disease cartography. Trends in Parasitology 32: 19–29. doi:10.1016/j.pt.2015.09.006.

Messina, J., M. Kraemer, O. Brady, et al. 2016. Mapping global environmental suitability for Zika virus. eLife 5. doi:10.7554/eLife.15272.

NASA LP DAAC, 2000-2014, Terra/Aqua Combined MODIS Nadir-BRDF Adjusted Reflectance 16-Day L3 Global 1km (MCD43B4). Version 005. NASA EOSDIS Land Processes DAAC, USGS Earth Resources Observation and Science (EROS) Center, Sioux Falls, SD (https://lpdaac.usgs.gov), https://lpdaac.usgs.gov/dataset_discovery/modis/modis_products_table/mcd43b4.

For more information

NASA Land Processes Distributed Active Archive Center (LP DAAC)

NASA Socioeconomic Data and Applications Center (SEDAC)

NASA Moderate Resolution Imaging Spectroradiometer (MODIS)

About the data
Satellites Terra and Aqua
Sensor Moderate Resolution Imaging Spectroradiometer (MODIS)
Data sets Gridded Population of the World, Version 4 Nadir BRDF-Adjusted Reflectance 16-Day L3 Global 1km V005 (MDC43B4)
Resolution 30 arc-second (~1-kilometer grid) 1 kilometer
Temporal resolution 5-year intervals between 2000 and 2020 16-day
Parameters Population density Nadir reflectance
DAACs NASA Socioeconomic Data and Applications Center (SEDAC) NASA Land Processes Distributed Active Archive Center (LP DAAC)

Details

Last Updated

Published

Data Center/Project

Land Processes DAAC (LP DAAC)
Socioeconomic Data and Applications Center (SEDAC)