Earth Day 2023: Explore Your World with NASA's Worldview

This Earth Day we invite you to explore global, full-resolution NASA Earth science data imagery to explore our ever-changing planet.
Earth Day 2023 banner image
Image Caption

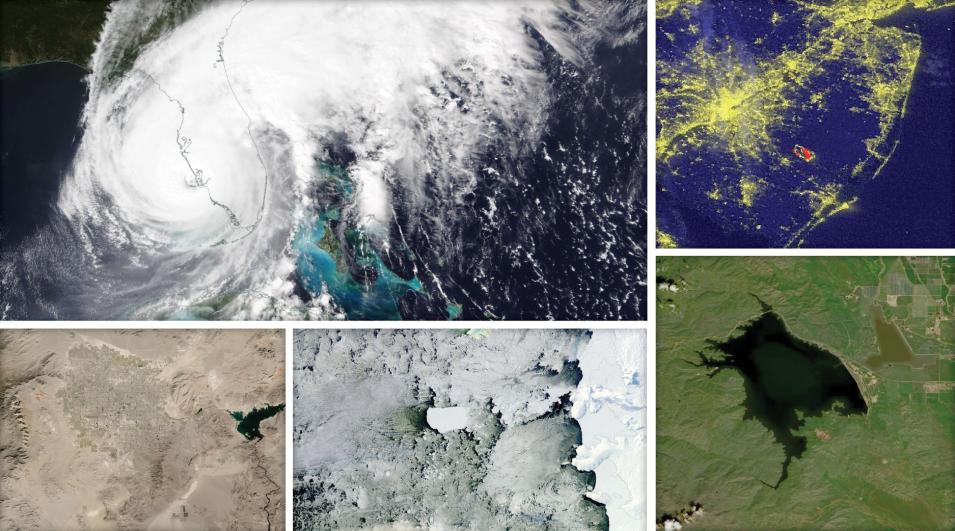
This Earth Day we invite you to explore our planet with imagery available through NASA's Worldview satellite imagery exploration tool. In the following images, you'll see tropical cyclones developing, reservoirs filling after torrential rain, wildfires spreading, and urban centers expanding. With NASA Worldview, you can also take a snapshot, create an animated GIF, or compare imagery from two dates to view changes over time. Start your Worldview explorations with these examples:

Learn more about NASA Earth science data and exploring these data in Worldview:

Hurricane Ian 2022

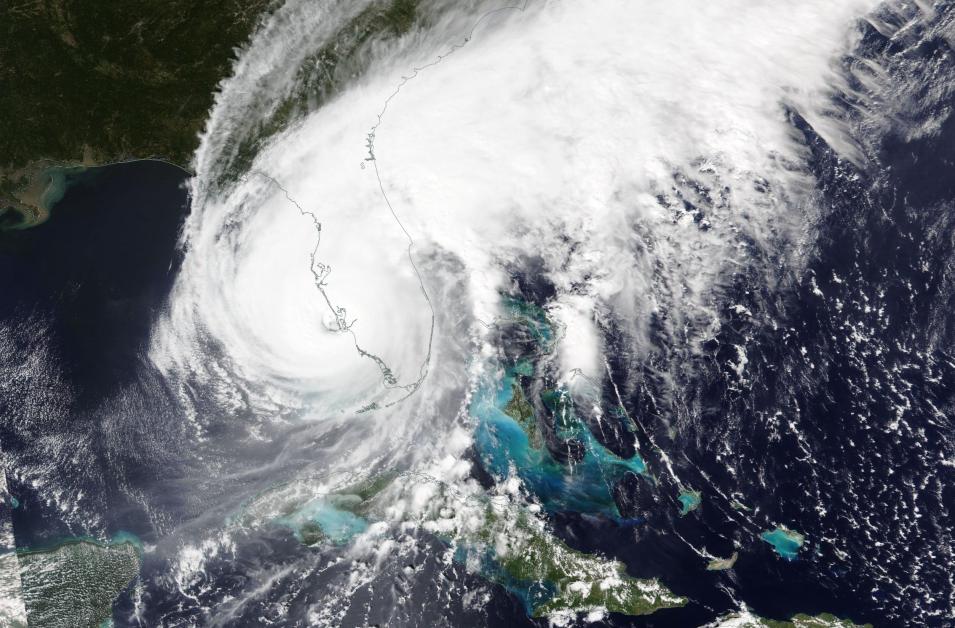
NOAA-20 VIIRS Corrected Reflectance Image of Hurricane Ian.
Image Caption

Hurricane Ian makes landfall on the west coast of Florida, September 28, 2022.

This true-color image from the Visible Infrared Imaging Radiometer Suite (VIIRS) instrument aboard the NOAA-20 satellite shows Hurricane Ian making landfall just south of Punta Gorda, Florida, on September 28, 2022. Ian was a Category 5 hurricane with wind speeds of 155 miles per hour. The powerful storm caused a catastrophic storm surge south of Tampa that, along with over 20 inches of rain, caused major flooding across the peninsula all the way to the Atlantic coast.

Viewing Tips

San Luis Reservoir, California

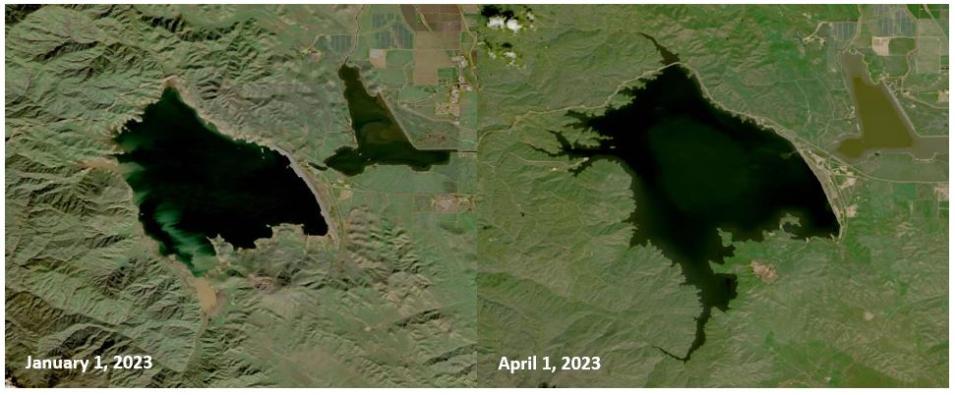
This Harmonized Landsat Sentinel-2 image pair compares  the San Luis Reservoir in California on January 1, 2023 and on April 1, 2023.
Image Caption

Note the change in the reservoir's water level between January 1, 2023, (left image) and April 1, 2023, (right image) after a series of atmospheric rivers brought record-breaking amounts of rain and snow to the region.

These Harmonized Landsat Sentinel-2 (HLS) images were acquired by the Multi-Spectral Instrument aboard the ESA (European Space Agency) Sentinel-2A and Sentinel-2B satellites. On December 1, 2022, the water level in California's San Luis reservoir (the fifth largest in the state) was estimated to be at one-quarter of its capacity. Thanks to the series of atmospheric rivers that brought record-breaking amounts of rain and snow to the state in early 2023, the reservoir is now nearly full.

Viewing Tips

  • Interact with the before-and-after comparison image of the San Luis reservoir.
  • With your cursor, toggle left and right between the January 1 image (A side) and the April 1 image (B side) to view changes in the reservoir’s water levels.
  • In the April 1 observation, notice that the southern tip of the reservoir, which was dry just three months prior, now has water.
  • Adjust the year, month, and date in the lower left corner for multiple-year comparisons.

Mullica River Fire, New Jersey

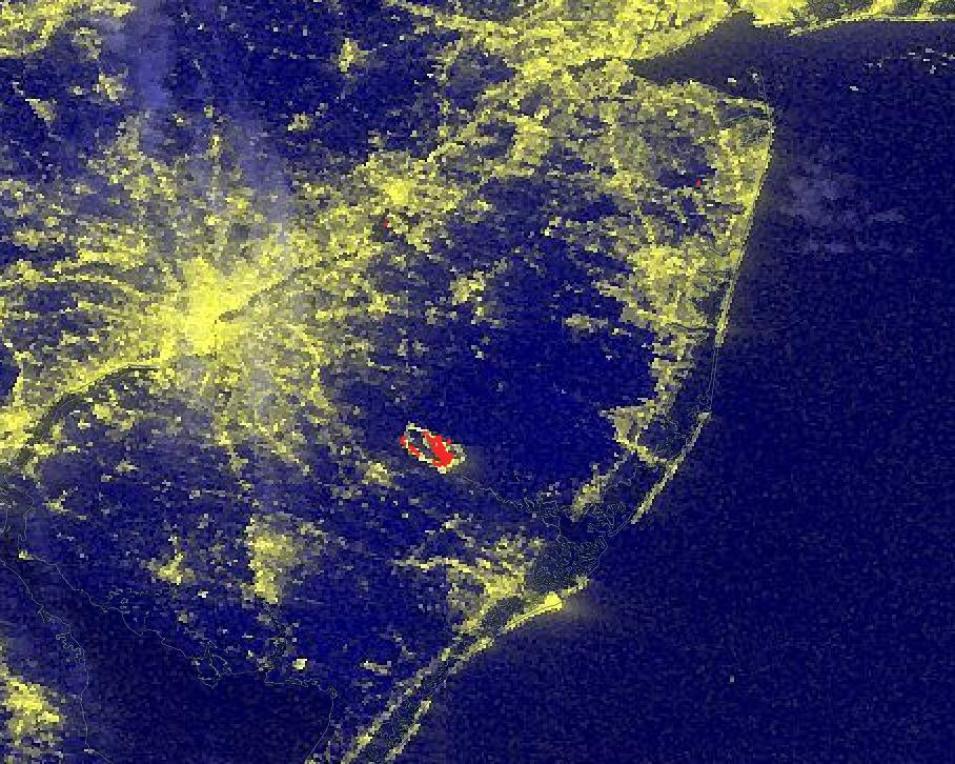
This image shows a combination of nighttime lights and active fire imagery for the Mullica River Fire, New Jersey on June 20, 2022.
Image Caption

In this Black Marble Nighttime Blue/Yellow Composite (Day/Night Band) image, the burning Mullica River fire is shown in red. City lights are shown in yellow.

This Black Marble Nighttime Blue/Yellow Composite (Day/Night Band) image from the VIIRS instrument aboard the NASA/NOAA Suomi National Polar-orbiting Partnership (Suomi NPP) satellite shows the Mullica River Fire burning southeast of Philadelphia, Pennsylvania, and northwest of Atlantic City, New Jersey, on June 20, 2022. The fire ignited on June 19, 2022, and grew to more than 12,000 acres over a 24-hour period. Fortunately, by the evening of June 21, the fire was mostly contained.

Viewing Tips

After Decades, Iceberg B-22A Drifts to Sea

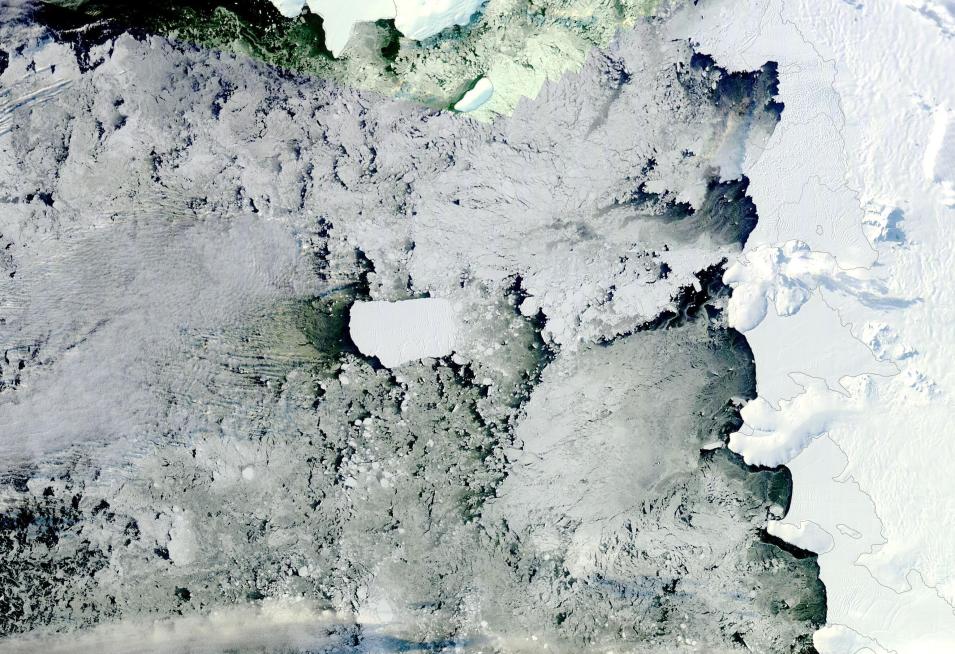
This NASA Terra Moderate Resolution Imaging Spectroradiometer (MODIS) image shows This image from the Moderate Resolution Imaging Spectroradiometer (MODIS) instrument aboard NASA’s Terra satellite shows B-22A–the largest piece of Antarctica’s B-22 iceberg–moving out to sea on  March 26, 2023. The massive B-22 iceberg measures more than 3,000 square kilometers and has only moved 60 miles from its birthplace, the floating ice tongue of Antarctica’s Thwaites Glacier, in the past two decades.
Image Caption

This image from the Moderate Resolution Imaging Spectroradiometer (MODIS) instrument aboard NASA’s Terra satellite shows B-22A–the largest piece of Antarctica’s B-22 iceberg–moving farther out to sea on March 26, 2023.

The massive B-22 iceberg, originally the size of Rhode Island, still measures more than 3,000 square kilometers and has only moved 100 km (60 miles) from where it calved off from the once extensive floating ice tongue of Antarctica’s Thwaites Glacier in 2002.

Viewing Tips

Urban Sprawl: Las Vegas, Nevada

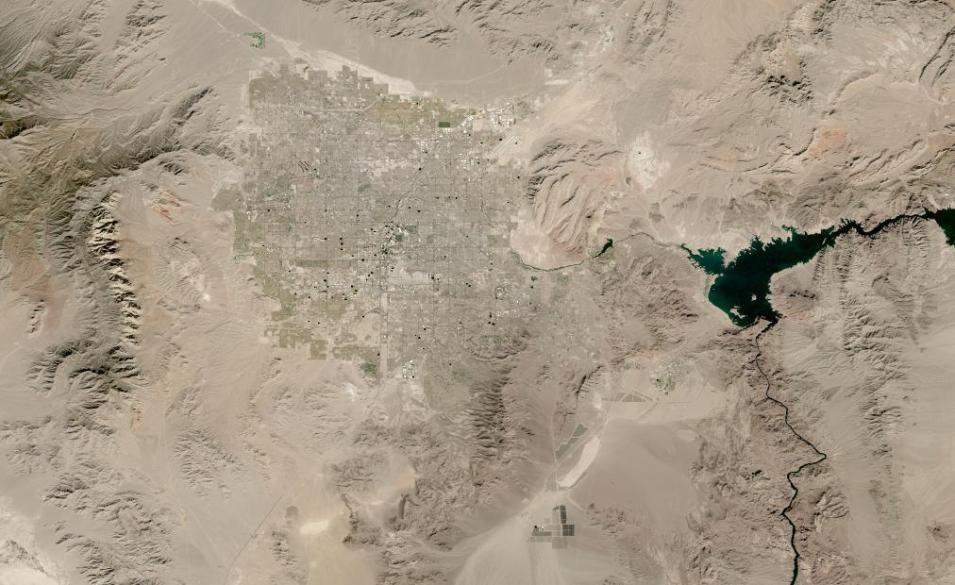
his Harmonized Landsat Sentinel-2 (HLS) image shows the size of Las Vegas, Nevada, on November 24, 2022. Created with data from the Operational Land Imager (OLI) instruments aboard the NASA/USGS Landsat 8 and 9 satellites.
Image Caption

This HLS image shows the size of Las Vegas, Nevada, on November 24, 2022. This image was created with data from the Operational Land Imager (OLI) instruments aboard the NASA/USGS Landsat 8 and 9 satellites.

The population of metropolitan Las Vegas has grown significantly over the last 30 years, from 530,000 people in 1984 to more than 2.8 million in 2022. HLS imagery and data support a wide range of applications, such as assessments of plant health, ecological monitoring, impacts of fires and other natural hazards, population growth, and more.

Viewing Tips

Learning Resources

Whether you are a scientist, an educator, a student, or just interested in learning more about how to use all the openly available data in NASA’s Earth Observing System Data and Information System (EOSDIS) collection, we have the resources to help! NASA's Earthdata Learn page will help you find what you need to get started with NASA Earth science data, services, and tools.

Getting Started with NASA Worldview Tutorial (December 2021)

In this tutorial, learn how to use NASA's Worldview imagery mapping and visualization application. We'll show you how to explore and visualize over 1,000 NASA Earth science satellite imagery layers, many of which are available within hours, even minutes, and spanning back 20 years. Worldview has been used for time-critical applications such as monitoring and managing wildfires, supporting science through easy-to-access satellite imagery archives, illustrating disasters and natural events in the media, and facilitating education and outreach. We show you how to create and export an image snapshot, animate imagery to see changes over time, compare imagery from different dates or different types of imagery from the same date, explore vector data layers like Fires and Thermal Anomalies, and much more!
Details

Last Updated

Published