Biomes in the Balance

How are landscapes in the Southwest adapting?

Just a few hours south of central New Mexico, a gust of hot wind spills over a rim rock canyon, gathers upon itself during its fast descent to the bottom, then spins and eddies as it tumbles out of the canyon and over the landscape. From high to lower and lower elevations, it flows through and over a Ponderosa forest, across a range of pinyon and juniper trees, meanders through a juniper savanna, then fans out over a vast desert grassland. As it makes its way along this journey and mixes with the air of these different biomes, or ecosystems, Marcy Litvak’s towers of instruments record its speed, direction, and carbon dioxide (CO2) content. These are just a few of the measurements she and her team need in order to study carbon cycling across the region.

Litvak, an ecologist with the University of New Mexico, already knows that the Southwest stores a great deal of carbon. But with predictions for hotter and drier climes looming for the region, the big mystery they hope to unravel is just how much change the landscape can absorb. Will these biomes continue to clean up excess carbon in the atmosphere as they have for millennia? Or will they be decimated by drought, beetles, fire, and other factors, never to return?
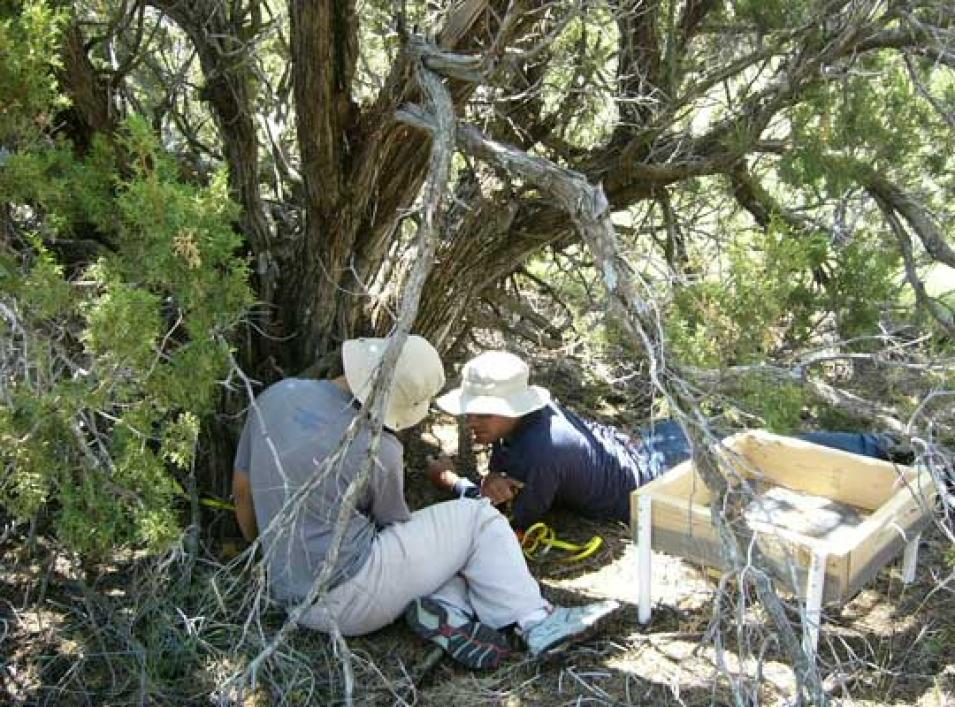
Researchers take tree measurements and collect samples in New Mexico
Image Caption

Researchers Shaila Shodean (left) and Andy Hawk (right) take measurements and collect tree litter, such as twigs, bark, and needles, from juniper trees in central New Mexico. (Photograph by K. Anderson-Teixeira courtesy Smithsonian)

Surprising sink

Scientists the world over are studying the balancing act of CO2 between the ocean, soil, shrubs, trees, and atmosphere. Yet the American Southwest is not what comes to mind when most people think of carbon storage; they may think instead of Earth’s rain forests, with their tall and lush vegetation. However, the Southwest is as ecologically diverse as it is vast. For Kristina Anderson-Teixeira, a forest ecologist at the Smithsonian and a former member of Litvak’s team, that makes it a perfect, living laboratory.

Anderson-Teixeira said, “One of the best things about New Mexico, and what allowed us to do this study there, is that you have great ranges in elevation with the mountain ranges. So you can go within a short space from a desert grassland or shrubland—hot and dry ecosystems with low biomass storage, like grasses and scattered, smallish shrubs—all the way up to conifer forest. By the time you get up there you’re in a relatively cool, moist forest with tall trees and high biomass storage.”

And it is a very large laboratory. “The extreme advantage we have in using a network such as this,” Litvak said, “is that we have six of the most dominant biomes that are represented throughout the Southwest. But if you look across Colorado, Utah, Arizona, and New Mexico, it represents about sixty percent of the total land area.” That amounts to millions and millions of acres, and a lot of carbon storage. But exactly how much?

It takes a network

To answer that question, the team has been diligently monitoring carbon cycling across the biomes for six years now. Armed with a dozen or so instruments apiece, each tower records a range of data, like CO2 in the air, precipitation, temperature, and energy exchange. Meanwhile, Litvak and her crew regularly head out to kneel in the dirt, scoop up soil, measure tree trunks and branches, and record a wide range of other biomass measurements. When combined, this array of data helps reveal the inner workings of each biome: how it normally functions and how it responds to variations in weather and climate. When temperatures rise and rain is sparse, for instance, they watch to see how one component responds across all biomes, such as the amount of water in the soil.

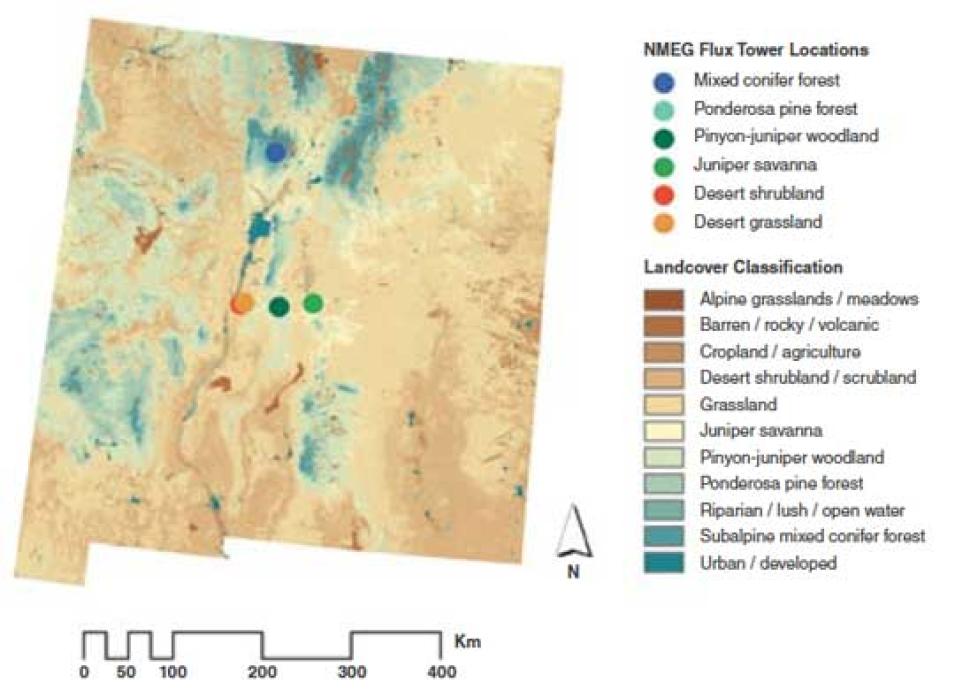
Data map of New Mexico showing the different types of land cover
Image Caption

This map of New Mexico classifies the different types of land cover present throughout the state (rectangles), and shows the locations of monitoring towers maintained by Marcy Litvak and her team. The towers (circles) were placed in six different types of biomes across varying elevations, forming a network called the New Mexico Elevation Gradient or NMEG. (Courtesy D. Krofcheck/M. Litvak/University of New Mexico/United States Geological Survey)

The team’s preliminary study focused on two related components, temperature and precipitation, and was a springboard for more complicated investigations to come. It confirmed most of what they expected. They found that the ability of these ecosystems to store carbon was indeed reduced under hotter and drier conditions. As temperatures rise, trees become stressed. And when less water is available, they are stressed further, less able to photosynthesize: breathe in CO2 and exhale oxygen (O2). That makes them much less effective at safeguarding carbon, but that is not all.

“What’s really interesting to me, and somewhat surprising actually, is how much both the middle and the high elevation sites were storing,” Litvak said. They found that these sites, such as pinyon-juniper woodlands and conifer forests, can store anywhere between 150 and 350 grams of carbon per square meter per year. “Compared with eastern U.S. forests, it’s true,” she said, “the amount of carbon that they take up per square meter is relatively low, but if you look at the extent of these biomes—across the Southwest, the United States, and across the globe—the total amount of carbon that they sequester is amazingly large.”

The end of a biome

Unfortunately, trees stressed by drought are easy targets for other threats like beetle infestation. Cooler temperatures in the past not only kept pinyon trees healthy, but also periodically killed off bark beetles in the winter. Anderson-Teixeira said, “If you drive around New Mexico, one of the dominant features of the landscape that you notice is that there’s a huge number of dead pinyon pine trees. And then at higher elevations there’s been some mortality of other species.”

Another complicating factor is that trees like pinyons are especially slow growers. They can take as long as one hundred years to produce cones and can live as long as one thousand years. And though even dead trees continue to store some carbon in their bark, an event like fire quickly releases this carbon into the atmosphere, creating a feedback loop. Litvak said, “So we can ask, all right, how long does it take them to recover? In effect, are we turning those pinyon-juniper woodlands into a juniper savanna after they die?”

That question has led the team to begin recording major disturbances across the sites, like drought and bark beetle infestation. To do so means stockpiling more data. More ground data, combined with satellite and even lidar data from planes are helping them track the quiet processes at work within each biome. Optical satellite imagery from sensors like the Moderate Resolution Imaging Spectroradiometer (MODIS) and Landsat, for instance, are helping them analyze millions of acres of vegetation to tackle carbon balance from a different vantage point.

A crossroads for change

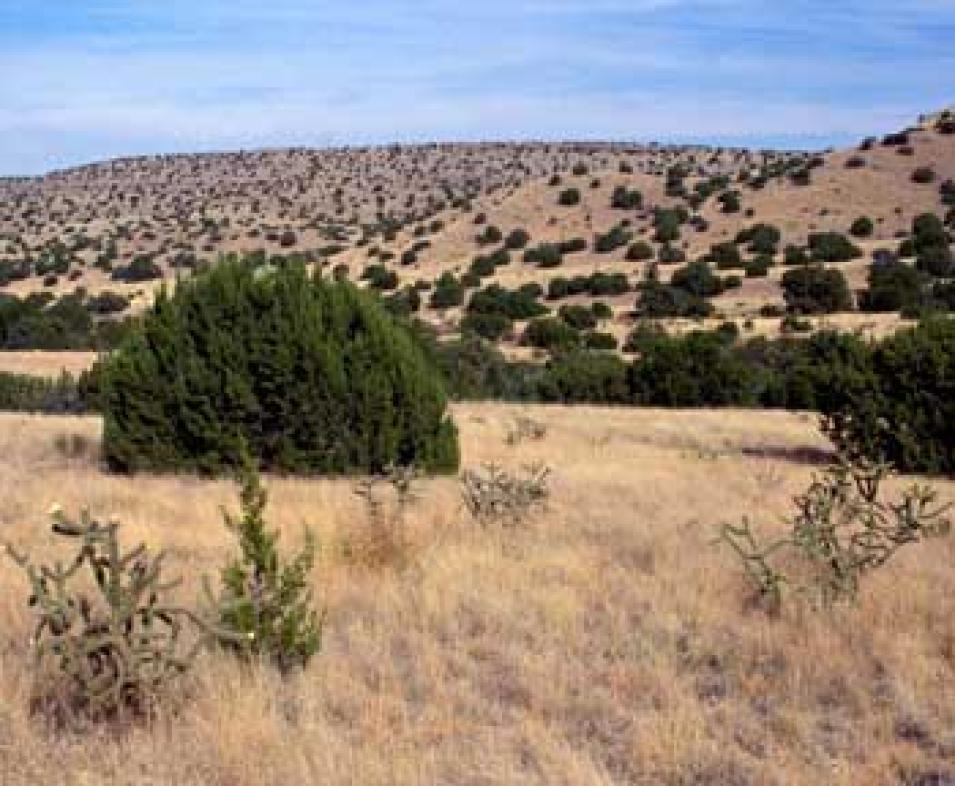
Photograph of a juniper-covered savanna in New Mexico
Image Caption

This juniper-covered savanna is one example of a biome in arid New Mexico that includes carbon-sequestering vegetation. (Courtesy K. Anderson-Teixeira)

Litvak’s ultimate goal is to keep the network going as long as possible. That the sites are clustered across a range of biomes, and are in a small enough area to experience similar weather patterns, makes it is easier to compare how they respond. And that the data are all processed the same way lends confidence to their results. “These are really bellwether biomes for change across this region, because they are so well represented,” she said. “So my big take home message would be how crucial it is to keep monitoring them.”

To get started, they looked at satellite imagery from the MODIS sensor, made available by NASA's Oak Ridge National Laboratory Distributed Active Archive Center (ORNL DAAC). MODIS vegetation images from the Terra satellite helped them pinpoint where distinct plant communities end and others begin, and where to erect each tower. Financing the effort was a hurdle, not to mention getting permission to erect the semi-permanent towers on various properties, from privately owned ranches to federally owned land. But they are already seeing the rewards of that effort. “What gets me really excited about this,” Litvak said, “is that we are able to directly monitor how these biomes are responding. You can actually see the sensitivity of all these biomes.”

The team is also gaining more ground, literally. They have managed to expand the network from six to nine towers. And though maintaining the tower network and its suite of instruments is demanding, it will continue to capture and catalog how the Southwest is changing over time. That information will go a long way toward helping scientists understand just how much carbon similar biomes can absorb, both locally and globally. “I don’t think anyone knows what’s going to happen,” Litvak said. “But drought, temperature—these are huge factors that are going to change in a significant way across these ecosystems and we’re going to be able to quantify how they are responding.”

Reference

Anderson-Teixeira, K. J., J. P. DeLong, A. M. Fox, D. A. Brese, and M. E. Litvak. 2011. Differential responses of production and respiration to temperature and moisture drive the carbon balance across a climatic gradient in New Mexico. Global Change Biology 17: 410–424, doi:10.1111/j.1365-2486.2010.02269.x(link is external).

For more information

NASA Land Processes Distributed Active Archive Center (LP DAAC)

NASA Oak Ridge National Laboratory DAAC (ORNL DAAC)

Moderate Resolution Imaging Spectroradiometer (MODIS)

Kristina J. Anderson-Teixeira

Marcy Litvak(link is external)

About the remote sensing data used
Satellite Terra
Sensor Moderate Resolution Imaging Spectroradiometer (MODIS)
Data sets MODIS Vegetation Indices 8-Day L4 Global (MOD15A2)(link is external)
Resolution 1 kilometer
Parameter Leaf Area Index (LAI)(link is external)/Fraction of Photosynthetically Active Radiation (FPAR)(link is external)
DAACs NASA Oak Ridge National Laboratory Distributed Active Archive Center (ORNL DAAC) NASA Land Processes DAAC (LP DAAC)

The photograph in the title graphic shows the range of biomes near Red Tank, New Mexico. (Courtesy K. Anderson-Teixeira)

Details

Last Updated

Published

Data Center/Project

Land Processes DAAC (LP DAAC)
Oak Ridge National Laboratory DAAC (ORNL DAAC)