Dr. Robert Wright

Data available from NASA’s LP DAAC helps scientists like Dr. Robert Wright develop systems for autonomously detecting volcanic eruptions from space.

Dr. Robert Wright, Director of the Hawaii Institute of Geophysics and Planetology, University of Hawaiʻi at Mānoa

Research Interests: The remote sensing of active volcanoes, including the development of systems for autonomously detecting eruptions from space, the retrieval of eruption parameters from satellite data such as lava effusion and flow cooling rates, and measuring the composition of gases emitted by volcanoes using mid- and long-wave infrared measurements; the development of hyperspectral imaging sensors; the use of cube satellites for Earth remote sensing, including the detection of volcanic eruptions and gas emissions.

Research Highlights: Twenty years ago, in October 2001, a volcano in the remote South Sandwich Islands known as Mount Belinda began lobbing ash into the sky and spitting lava from its summit. Had the eruption occurred three years earlier, it might not have been detected for weeks or even months. However, because NASA’s Terra satellite was then orbiting the Earth (launched December 18, 1999) and carrying the Moderate Resolution Imaging Spectroradiometer (MODIS) instrument, a team of researchers at the University of Hawaii almost 9,000 miles away knew about it less than 24 hours after it started.

It’s estimated that there are more than 1,500 potentially active volcanoes around the globe, and 500 of them are said to be active at any given time. Traditionally, scientists have kept tabs on active volcanoes with ground-based observation tools, but the use of Earth-observing geostationary and polar-orbiting satellites is quickly becoming the primary method of monitoring Earth’s volcanic activity. Thanks to on-going advances in satellite instrumentation and new methods of data analysis, scientists can now monitor volcanic activity in the most isolated parts of the globe, detect changes in the atmosphere and Earth’s surface that suggest an eruption may be imminent, and even predict when an eruption will end by tracking its lava flow rate.
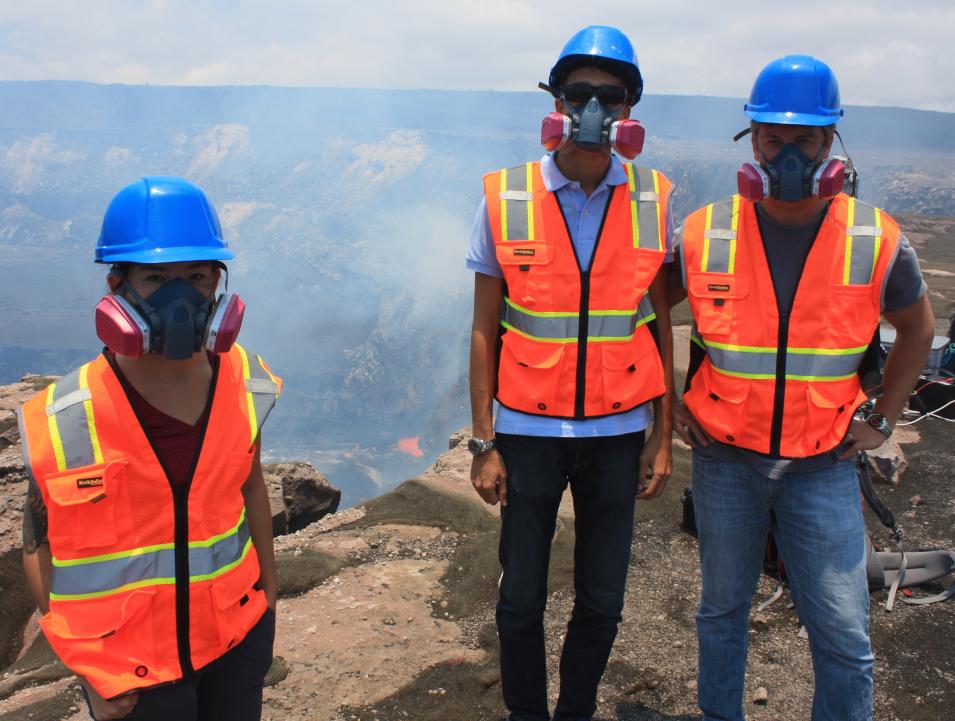
Photograph of Dr. Wright (right) in the field at the Halemaumau lava lake in 2018
Image Caption

Wright (right) in the field at the Halemaumau lava lake in 2018, conducting field tests of a Long Wave Infrared and Mid-Wave Infrared spectrometer used to measure the composition of the lake’s gas plume. With him in the photo are his former students, Dr. Andrea Gabrieli (middle), now post-doctoral researcher at the University of Hawaii, and Dr. Casey Honniball (left), now post-doctoral researcher at the NASA Goddard Space Flight Center in Greenbelt, Maryland. Credit: Dr. Robert Wright.

Among the scientists at the forefront of developing these technologies and methods of data analysis is Dr. Robert Wright, Director of the Hawaii Institute of Geophysics and Planetology (HIGP) at the University of Hawaiʻi at Mānoa. The HIGP is a multidisciplinary institute conducting research, technology development, and instruction in, geophysical, geological, planetary sciences, and space technology development, and it is there that Wright conducts research into how satellites can be used to monitor and measure volcanic activity from space. Using sensors flown in both low Earth and geostationary orbit, Wright has developed techniques to calculate the temperatures, cooling rates, and effusion rate of active lava flows and lava domes, developed computer models that predict the potential impacts of lava flow hazards, and spectroscopic techniques for measuring the composition of gases that volcanoes emit.

In addition to his position with the HIGP, Wright is also a User Working Group member of NASA's Land Processes Distributed Active Archive Center (LP DAAC). Located at the U.S. Department of the Interior’s USGS Earth Resources Observation and Science (EROS) Center in Sioux Falls, South Dakota, LP DAAC ingests, processes, archives, and distributes data products related to land processes in NASA’s Earth Observing System Data and Information System (EOSDIS) collection. These data are crucial to the investigation, characterization, and monitoring of biological, geological, hydrological, ecological, and related conditions.

“I have used data from many satellite instruments to study active volcanoes, including Landsat’s Thematic Mapper (TM) and Enhanced Thematic Mapper Plus (ETM+), NOAA polar-orbiting satellites’ Advanced Very High Resolution Radiometer (AVHRR), Terra’s Advanced Spaceborne Thermal Emission and Reflection Radiometer (ASTER), imagers aboard NOAA’s Geostationary Operational Environmental Satellites (GOES), the EO-1 satellite’s Hyperion instrument, Terra’s and Aqua’s MODIS and the joint NASA/NOAA Suomi National Polar-orbiting Partnership (Suomi NPP) and NOAA-20’s Visible Infrared Imaging Radiometer Suite (VIIRS),” Wright said. “NASA Earth science data is especially useful for as it is available with low latency, is well calibrated, and is without cost.”

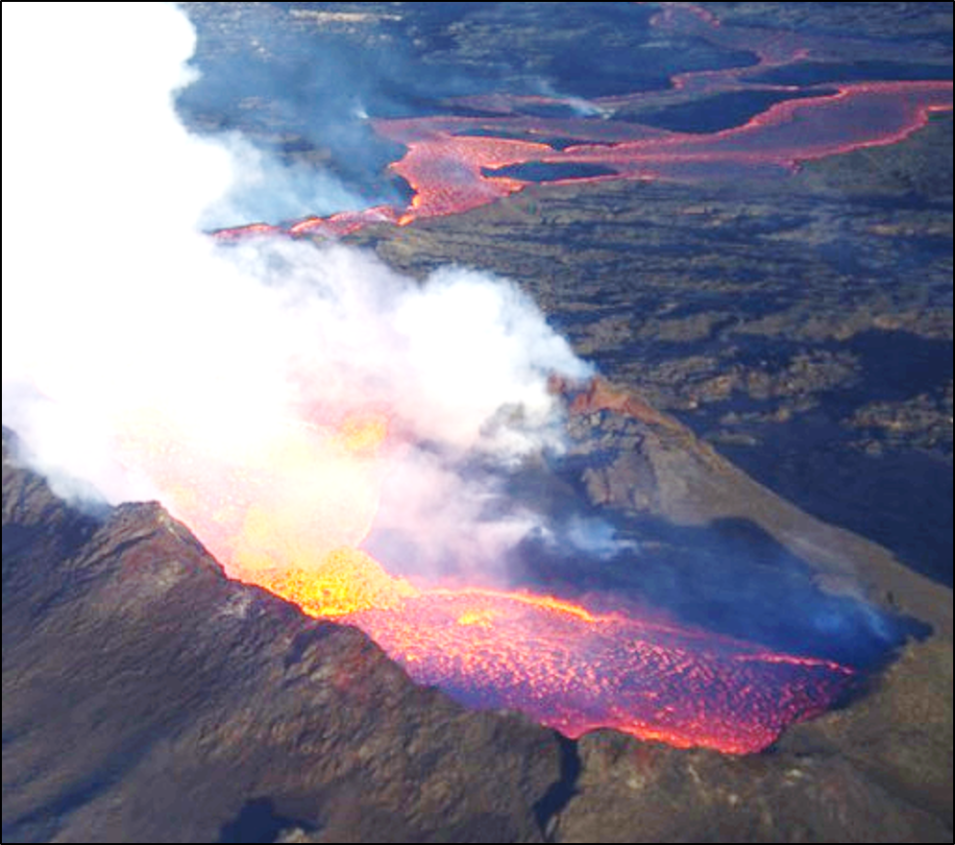
An aerial image of the Iceland's Holohraun volcano erupting in late November 2014.
Image Caption

An aerial image of the Iceland's Holohraun volcano erupting in late November 2014. Credit: Dr. Robert Wright.

Today, Wright primarily uses MODIS data from LP DAAC. Among the datasets used in his most recent research are MODIS 1 km calibrated radiance products (from both the Terra and Aqua satellites), which retrieve both land surface temperature and spectral emissivity (i.e., the surface’s ability to emit energy as thermal radiation) data from three MODIS thermal infrared bands. He has also used VIIRS calibrated radiance data products from the Suomi NPP satellite, which use the same input geolocation products and algorithmic approach as the MODIS products. According to the LP DAAC website, the overall objective for the VIIRS products is to ensure the algorithms and products are compatible with the MODIS Terra and Aqua algorithms to promote the continuity of the NASA Earth Observing System mission.

For example, Dr. Estelle Bonny, while pursuing her Ph.D. under Wright’s supervision, used MODIS Land Surface Temperature and Emissivity data in a 2017 paper, Predicting the End of Lava Flow-Forming Eruptions from Space, published in the Bulletin of Volcanology. This study investigated a method for answering one of the most important questions in volcanology: How can scientists better predict not only when eruptions will begin, but also when they’ll end?

“The volcanological community has focused much attention on predicting when an eruption will begin, mainly taking cues from seismicity, ground deformation, thermal emissions, or gas emissions,” writes Bonny, the paper’s lead author, and Wright in the paper’s introduction. “However, accurately forecasting when an eruption will end is similarly important in terms of hazard mitigation. This is especially true for lava flow-forming eruptions that can threaten population centers built down slope of vents.”

Their paper proposes an answer in the form of a method for forecasting the end of eruptions using near real-time MODIS thermal infrared data acquired during lava flow-forming eruptions from NASA’s Land, Atmosphere Near real-time Capability for EOS (LANCE).

“When a lava flow forming eruption begins, the flow rate of lava from the vent is initially very high and quickly rises to a peak (as the magma chamber pressure is highest at eruption onset),” Wright said. “As the pressure in the chamber falls, the lava flow rate decreases gradually. MODIS thermal data can track how this effusion rate changes with time and, by recognizing when the peak flow rate has been attained. We can then use even a small number of subsequent MODIS observations to predict the time at which the eruption will end with accuracy, even during the very early stages of an eruption.”

Although the method described in their paper does not apply to all eruption types or situations, the authors say that, when conditions are right, thermal infrared satellite data can be used to predict the end of effusion (i.e., the oozing of lava from a volcanic vent) “with high accuracy” before the midway point of the eruption and “reasonable accuracy” even earlier in the eruption timeline, such as after the eruption’s onset.

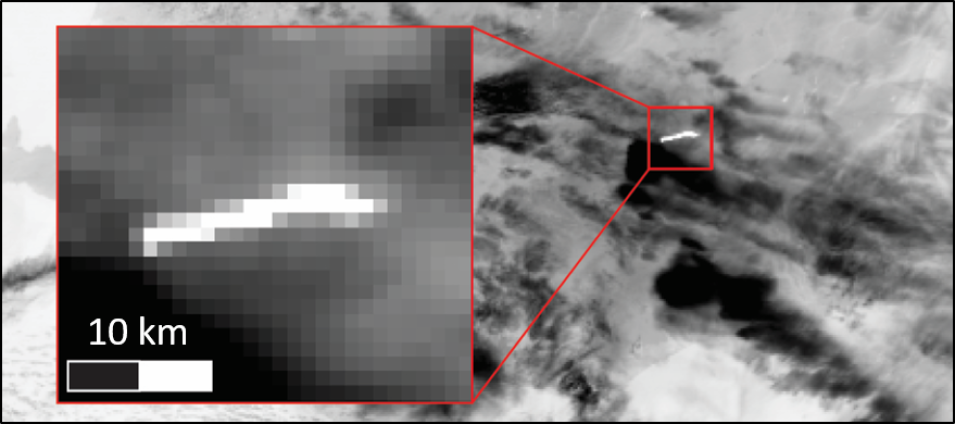
This MODIS one-kilometer calibrated radiance image shows the eruption of Iceland’s Holohraun volcano in September 2014
Image Caption

This MODIS one-kilometer calibrated radiance image shows the eruption of Iceland’s Holohraun volcano in September 2014. Credit: Dr. Robert Wright.

These findings are significant, Bonny and Wright say, as the application of this method to an effusive eruption in real-time could aid lava flow hazard mitigation by reducing the uncertainty of not knowing when months-long lava flow eruptions will end.

In addition to using Earth-observing satellite data to devise ways of predicting when effusive eruptions will end, Wright and his colleagues are also using it to develop new approaches for measuring volcanic thermal unrest around the globe.

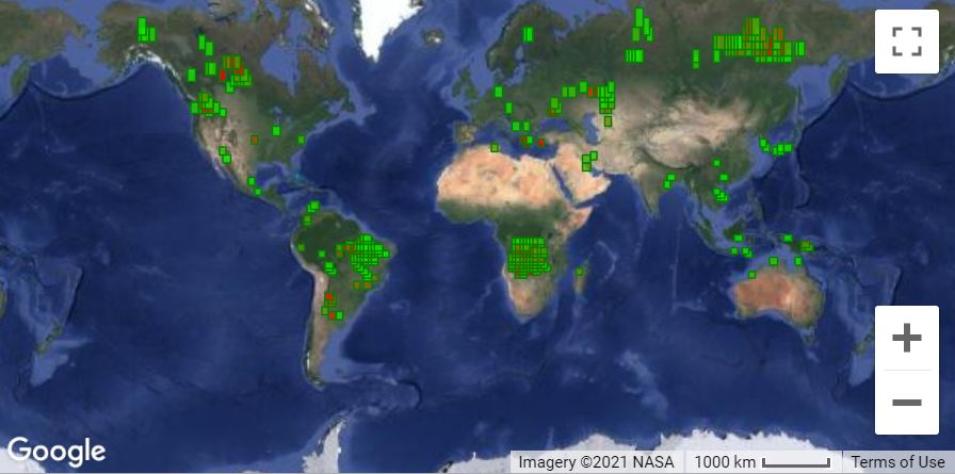
For example, Wright is Principal Investigator for the HIGP’s MODVOLC project, the world’s first autonomous, global, space-based volcano monitoring system. The MODVOLC system uses MODIS infrared satellite data to monitor Earth’s surface for the thermal emission signatures of volcanic eruptions, wildfires, and anthropogenic heat sources (e.g., gas flares). If an eruption or other heat source is detected, its details are reported on the MODVOLC website one to two hours of the NASA’s Aqua or Terra satellites passing over the volcano.

Used by volcanologists around the world, Wright said the MODVOLC system could never have been implemented were it not for the MODIS data available from LANCE and LP DAAC.

“The [MODVOLC] algorithm has been scanning every MODIS granule acquired since February 2000, scanning every square kilometer of Earth's surface for evidence of volcanic thermal unrest, and making the data available to users in real-time,” said Wright. “For the first 15 or so years we provided results within about 12 hours of satellite overpass,” he said. “A few years ago, we transitioned operations to LANCE and we can now detect an eruption anywhere on the globe within a couple of hours of the spacecraft going overhead.”

A map of volcanoes around the globe as seen on the MODVOLC website.
Image Caption

A map of volcanoes around the globe as seen on the MODVOLC website.

Now, that MODVOLC is established and serving the international volcanology community, Wright and his colleagues at the HIGP are trying to improve it—and plan for the post-MODIS future.

“We are currently developing a new approach which will improve the sensitivity of the algorithm by a factor of 2, with little additional computational complexity, and allow seamless transition between the MODIS era and the VIIRS era going forward,” Wright said. “This will allow us to build a 30-plus-year archive of thermal emission data for all of Earth's volcanoes, from which patterns in eruption intensity will emerge.”

Beyond making the most of existing technologies, Wright and his team are also experimenting with new technologies, such as CubeSats and hyperspectral imagers, that will produce new data streams for measuring volcanic gasses from space.

In August 2018, the HIGP received funding from NASA in support of a two-year project to develop the Hyperspectral Thermal Imager (HyTI) CubeSat, a 6-Unit Cube Satellite that will be launched into a 400 km orbit from the International Space Station in 2022 (CubeSats are built to standard dimensions of 10 cm x 10 cm x 10 cm units, abbreviated as “U.” They can be 1U, 2U, 3U, or 6U in size.) CubeSats are small satellites intended for low Earth orbit that can be used to explore a variety of scientific and technological questions. Working in collaboration with NASA’s Jet Propulsion Laboratory and several companies, Wright and his HIGP colleagues are using the HyTI CubeSat mission to demonstrate how CubeSat technology can be used to monitor volcanic hazards from space.

“Cube satellites offer the possibility of acquiring high spatial resolution data with high temporal frequency,” said Wright. “The HyTI mission will demonstrate how volcanologically useful data sets can be acquired by a satellite the size of a shoe box. The low cost of these missions means that we may also be able to have constellations of Cubesats dedicated to studying volcanoes, which is something we have never had in the past.”

Having a constellation of eyes in the sky watching Earth’s volcanoes is important, and not just because it’s the next step in Earth-observation technology. The overarching goal of Wright’s research is a better understanding of how Earth’s volcanoes behave, and that can only result from a multi-pronged approach that involves Cubesat constellations with the latest imagers, long-term data records revealing patterns in eruption attributes, new methods for calculating beginning and end of eruptions, and, yes, even ground-based observation tools.

Representative Data Products Used or Created:

Available through LP DAAC

Other data products used:

Read About the Research:

Honniball, C.I., Wright, R., Lucey, P., & Khayat, A. (2020). Evaluating the spectro-radiometric performance of an uncooled mid-wave infrared hyperspectral interferometer using a microbolometer array detector. Optical Engineering, 59(7), 074103. doi:10.1117/1.OE.59.7.074103

Bonny, E. & Wright, R. (2017). Predicting the end of lava-flow-forming eruptions from space. Bulletin of Volcanology, 79. doi:10.1007/s00445-017-1134-8

Wright, R., Blackett, M., & Hill-Butler, C. (2015). Some observations regarding the thermal flux from Earth’s erupting volcanoes for the period 2000 to 2014. Geophysical Research Letters. doi:10.1002/2014GL061997

Explore more Data User Profiles

Details

Last Updated

Data Center/Project

Land Processes DAAC (LP DAAC)