The International Geoscience and Remote Sensing Symposium (IGARSS) brings together scientists, researchers, practitioners, and policymakers from around the globe to share their knowledge, insights, and latest advancements in the domain. IMPACT is bringing a tutorial and presentations to IGARSS 2023 highlighting cutting-edge research, advancements in satellite technology, and novel remote sensing applications. In the run-up to the event, we will be previewing several of these presentations that you can put on your session calendar.
End-to-End Machine Learning with Supercomputing and in the Cloud
Sun, 16 Jul, 09:00–17:00 Pacific Time (UTC -7)
Recent advances in remote sensors with higher spectral, spatial, and temporal resolutions have significantly increased data volumes, which pose a challenge to process and analyze the resulting massive data in a timely fashion to support practical applications. Data intensive computing approaches have become indispensable tools to deal with the challenges posed by applications from geoscience and remote sensing.
The theoretical parts of the tutorial provide a complete overview of the latest developments of high performance computing (HPC) systems and cloud computing services. Participants will understand how the parallelization and scalability potential of HPC systems are fertile ground for developing and enhancing machine learning (ML) and deep learning (DL) methods. Participants will also learn how high-throughput computing systems make computing resources accessible and affordable via Internet (cloud computing) and that they represent a scalable and efficient alternative to HPC systems for particular ML tasks.
For the practical parts of the tutorial, the attendees will receive access credentials to work with the HPC systems of the Jülich Supercomputing Centre and AWS cloud computing resources. The participants will be able to start working on the exercises directly with our implemented algorithms and data. The participants will work through an end-to-end ML project where they will train a model and optimize it for a data science use case. They will first understand how to speed-up the training phase through state-of-the-art HPC distributed DL frameworks. Finally, they will use cloud computing resources to create a pipeline to push the model into the production environment and evaluate the model against new and real-time data.
A Configurable and Interactive Dashboard for Earth Observation
Mon, 17 Jul, 16:21–16:33 Pacific Time (UTC -7)
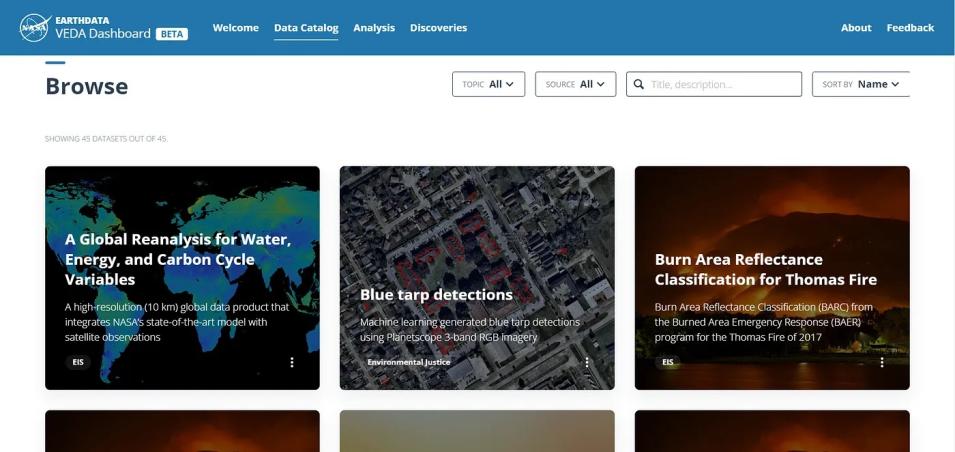
There is a need within the NASA Earth science web ecosystem to provide interactive data visualization and data exploration to support science discoveries related to environmental changes. Following the success of the COVID-19 dashboard, built to track and monitor changes to the environment due to the slowdown in human activity during the COVID pandemic, it was a natural transition to adopt this open-source dashboard concept to design and develop a cloud-native environmental change dashboard. As part of the Visualization, Exploration, and Data Analysis (VEDA) project, the VEDA dashboard attempts to meet that need by leveraging analysis-ready cloud-optimized data, a high-performant data catalog, a simplified publication workflow, and the latest development in web visualization.
The dashboard also supports a simplified publication workflow, which enables data producers to easily publish their datasets and findings. The publication process is designed to be as streamlined as possible, allowing data producers to focus on their analyses and discoveries, rather than worrying about the technical aspects of publishing. This aligns with VEDA’s goal of providing an easy-to-use platform for science communication.
