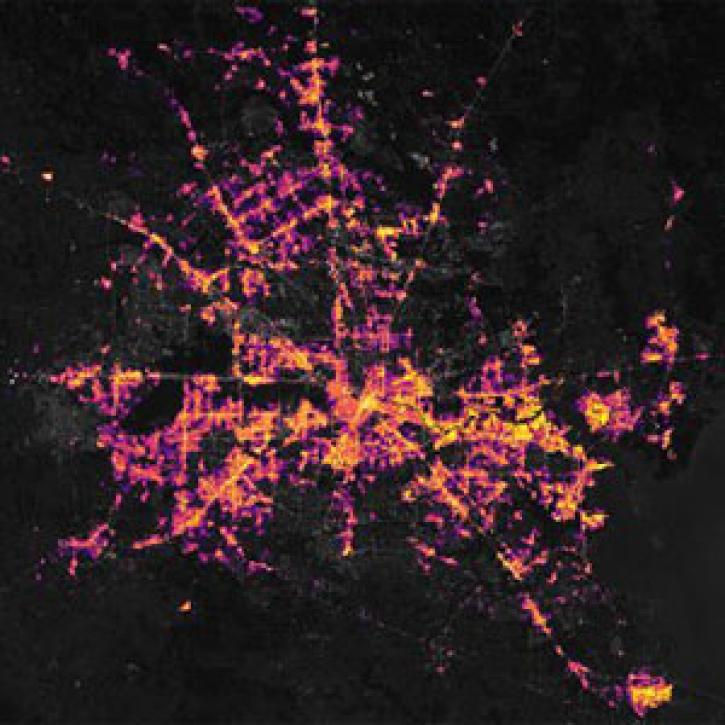
Access a range of datasets and data tools to further your research into biodiversity functions.
The term "biodiversity" is used to describe the abundance and variety of life on Earth. Having a diverse assemblage of plants, animals, and other organisms in a wide range of habitats promotes ecosystem productivity. Thriving, diverse ecosystems help balance processes like nutrient storage and recycling, pollution filtration, and water resource maintenance. In addition, diverse ecosystems trap vast amounts of carbon and are vital sources of medicine.
Over half of the world’s biodiversity has disappeared since 1970, with an estimated 1 million animal and plant species threatened with extinction—a number greater than at any other time in human history. These declines in biodiversity are largely due to human interactions with the environment through activities including large-scale farming, increased use of chemical pesticides and herbicides, the introduction of non-native species through global transport, and urban expansion due to population growth.
NASA Earth observation data provide insight into the causes behind changes in biodiversity and the impacts of these changes. Remote sensing and field-based data from NASA and partner federal agencies have been used to assess the health of forests, detect tree cover loss, and prevent the spread of invasive species. Data on vegetation health, primary productivity, evapotranspiration, forest structure, and ocean chlorophyll shed light on the health and productivity of the biosphere. NASA data can also be used to study the suitability of an environment for different species, as well as species distribution within a habitat.
NASA's Biological Diversity and Ecological Conservation programs support basic and applied research as part of NASA’s Earth Science Division (ESD). The Biological Diversity Program is part of the ESD Research and Analysis Program within the Carbon Cycle & Ecosystems Focus Area and supports basic research that advances the understanding of how and why biological diversity is changing. The Ecological Conservation Program is part of the ESD Applied Sciences Program and focuses on the transfer of research to effective decision support for natural resource management. Both the Biological Diversity and Ecological Conservation programs fund competitively solicited research at academic institutions, non-governmental organizations, and the private sector.
Learn How to Use Biodiversity Functions Data
Join Our Community of NASA Data Users
While NASA data are openly available without restriction, an Earthdata Login is required to download data and to use some tools with full functionality.
Learn About the Benefits of Earthdata LoginFrequently Asked Questions
Earthdata Forum
Our online forum provides a space for users to browse thousands of FAQs about research needs, data, and data applications. You can also submit new questions for our experts to answer.
Submit Questions to Earthdata Forumand View Expert Responses