Mercury Raining

Today's forecast calls for atmospheric explosions and mercury rain.
author-share

Air Force pilots flying over the Arctic in the 1950s first noticed a brown haze and wondered “What the heck is that?” said researcher Paul Shepson. It turns out an element called bromine was partly to blame for the dirty hue. Today atmospheric chemists like Shepson know it is actually part of the Arctic atmosphere doing its own spring cleaning. “Mother Nature got a really good idea,” he said.

Every March in the Arctic, the atmosphere follows a certain cleaning regimen: combine upwelling bromine, plenty of cold air, and spring sunlight. When these ingredients mix, a chemical chain reaction ensues, and scrubs pollution out of the air. Scientists call this reaction a bromine explosion. The result? The atmosphere is much cleaner, but there is a catch. The cleaning process works so well that it causes a gaseous form of mercury to fall out of the sky.

So what happens to all that mercury? Does it get released back to the atmosphere, or does it stick around? That question led Shepson and colleagues to understand more about bromine explosions as the Arctic continues to warm and change.

Image
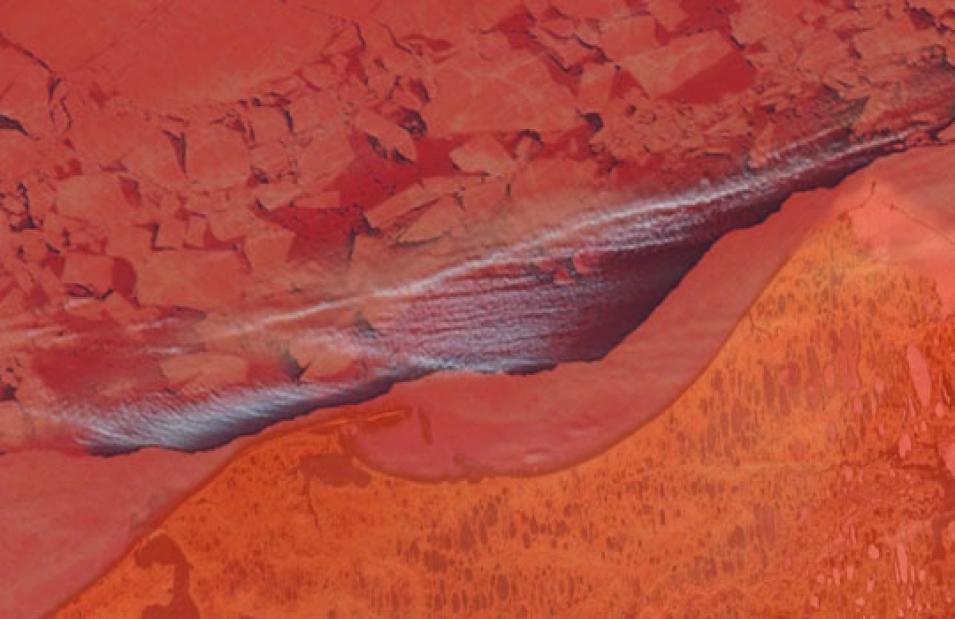
Satellite image showing vapor plumes welling up from leads in the Chukchi and Beaufort seas
This false-color satellite image shows sea ice in the Chukchi and Beaufort seas (red) near Barrow, Alaska. Dark areas indicate cracks, or leads, in the sea ice while gray streaks show vapor plumes upwelling from the leads. Red-orange shades indicate snow cover. The image was created with data acquired by the Terra MODIS satellite on March 24, 2012. (Courtesy NASA, Nghiem, et al. 2013)

In search of salt

Barrow, Alaska is an ideal place to get a closer look at bromine explosions. At the northernmost tip of the U.S., this small town looks like an arrow pointing toward the Arctic Ocean. To the left and right are the Chukchi and Beaufort seas. In several ways, this makes Barrow a salty place, and sea salt contains bromine.

Frost flowers also contain it. These delicate, crystalline structures sprout on top of fresh sea ice when the air is calm and colder than the ice below. As if by magic, sea salt is pulled to the surface of the ice and forms a tiny root-like opening. Saturated water vapor then threads more salt up the opening into the freezing air until it builds on itself, eventually appearing as frost in full bloom. “Scientists are human like everyone else, and we’re attracted to bright, shiny things,” explained Shepson. But the flowers are more than beautiful. Frost flowers contain about three times as much salt as any other type of frost or surface, and possibly a lot of bromine.

Image
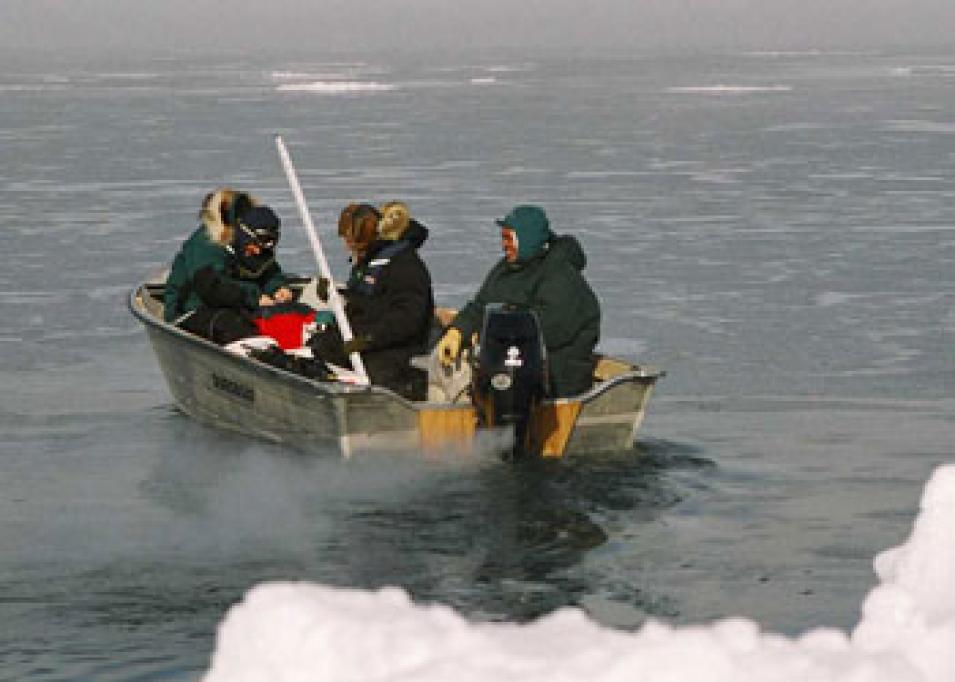
Photograph of researchers boating into a sea ice lead to collect samples
From left to right, researchers Bill Simpson, Matthew Sturm, and Carl Kippe venture out into an open sea ice lead to collect water samples and measure upwelling vapor for its bromine content. (Courtesy D. Perovich/Cold Regions Research and Engineering Laboratory)

Another potent source of bromine, they reasoned, might be the fresh sea ice. When ocean water freezes, salt accumulates into droplets called brine that can get trapped in watery pockets between ice crystals. If the ice is frozen long enough, say one to ten years, the brine eventually drains out. So an ideal place to measure bromine was over both new and old sea ice, over salty conditions and not-so-salty conditions. Huge cracks in the sea ice, called leads, were just the place.

One of local fame is the Barrow Lead. The Inupiaq people stand at the edge of this wide “whale road” every spring to hunt bowhead whales. Subsistence whale hunters like the Inupiaq can normally walk right from the shore on sturdy landfast ice, the ice attached to land, and set up their camps on heavy multiyear ice. But as recently as spring 2013, scientists at the University of Alaska Fairbanks reported finding zero multiyear ice in the Beaufort Sea. As Arctic sea ice conditions continue to change, scientists are grappling with how these changes will shape future conditions. Shepson said, “If we sample the air above all these surfaces that represent the old world, like the multiyear ice, and above lots of fresh, new ice like we have now, and over what represents the future—meaning open water—we can predict how climate change will impact the Arctic’s ability to clean itself.”

Son Nghiem, lead scientist for the bromine investigation, wondered if such change has led to more bromine explosions, and possibly more mercury ending up on the land or ocean. On the other hand, since bromine reactions require frigid temperatures, they might eventually stop altogether with a warmer Arctic. There was also the mercury. Does it change back into a gas and return to the atmosphere, or does it wind up in the food chain?

Searching high and low

These complex questions called for a complex approach. Nghiem said, “From the ground, to the air, to space, we measured it all.” Nearly thirty researchers conducted the Bromine, Ozone, and Mercury Experiment (BROMEX), in spring 2012. They used half a dozen satellites to gather data over Barrow and the Chukchi and Beaufort seas for bromine, mercury, and other atmospheric markers like ozone. With an eye out for polar bears, they also set up instruments at field sites and combed the area for snow, ocean, and air samples.

Other measurements were riskier to gather. They needed to place instruments in the Barrow Lead just before the spring melt began breaking up the ice. Physical scientist Matthew Sturm knew the challenges firsthand from his days with the U.S. Coast Guard and U.S. Army. “It’s sort of like the winter world you’re used to,” he said, “except it’s things breaking up, and sliding around, and getting crunched up.” His task was to somehow get two instrument-laden buoys to hitch a ride on chunks of ice as they floated down either side of the lead. “The goal was to put each instrument out far enough to see the bromine explosions, but not so far so that it couldn’t talk back to us, and not so far that it would get swept away,” he said. Adding to the challenge was the small window they would have. It had taken the team months to design and outfit the expensive instruments, but they would have just a few minutes to deploy them from a helicopter. Nghiem said, “Matthew knows Alaska like the back of his hand. It worked perfectly, and that is tremendous.”

They also needed to gather air samples over remote areas with small aircraft. Fortunately, atmospheric chemist Shepson was also a skilled pilot. Spotting frost flowers during one flight, he banked to fly downwind from them for the best bromine measurements, always mindful of where to land his small plane in case of engine failure. “It’s incredibly beautiful up there,” he said. “Sometimes scary though. We flew over pretty unpopulated areas. Really unpopulated areas.”

Image
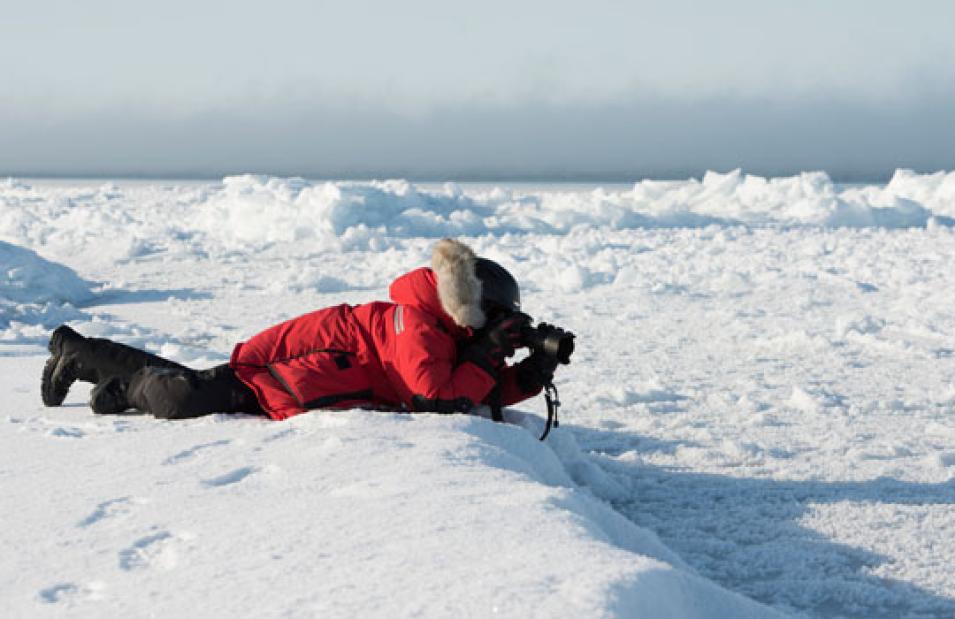
Photograph of a researcher photographing frost flowers on sea ice
Scientist Ignatius Rigor lies at the edge of a frozen sea ice lead to photograph frost flowers. In the background, a vapor plume can be seen along the horizon as it wafts up from an open crack further down the lead. (Courtesy C. Linder/chrislinder.com)

Unexpected leads

As the researchers suspected, the data confirmed that more bromine explosions are occurring now than at any other time in the past twenty years—but not near frost flowers. “We were looking for a smoking gun,” said Bill Simpson, a chemist at the University of Alaska Fairbanks. “We were expecting to see a huge amount of bromine coming from them, but it just wasn’t there.” Instead, it was the air above the tundra slightly inland that was steeped in bromine.

Simpson and his colleagues believe snow might be a factor in at least two ways. First, blowing snow carries sea salt from the top of the ice further inland than it otherwise might travel. Once on land, the snow blows across the surface and piles up in drifts. In this way, a small volume of salt gets spread over large distances, effectively covering the surface.

Image
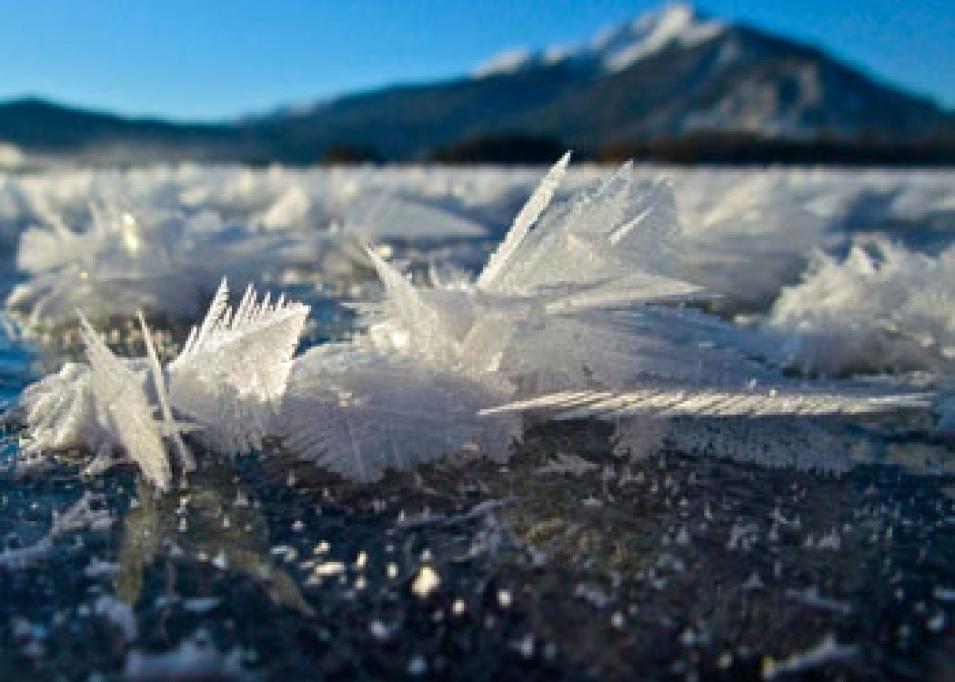
Photograph of frost flowers on ice
A field of frost flowers in full bloom catches the springtime sunlight. These freshwater frost flowers are similar in appearance to their salty, arctic counterparts. (Courtesy B. Berwyn/Summit County Citizens Voice)

Samples also revealed that the snow cover is more acidic than other surfaces. And that acidity helps initiate the reaction by chemically unlocking the bromide in the salt, which is bromine in its non-reactive form, and releasing it to the atmosphere where it becomes reactive. “It’s an amazing, invisible process,” Sturm said. “If I told someone in a bar about this, they’d think I was crazy. You can’t see it without these instruments and satellites, but it’s there.”

Whatever role snow plays, however, remains to be solved in the next round of studies. But the team confirmed that mercury dropped on the surface does not go away; it accumulates. And since plankton and fish cannot digest it, it can get passed along the food chain to whales and of course people. Sturm said, “Mercury deposited in the Arctic could be coming from a power plant in Florida or from a volcano. But the Arctic can plate it out better than any other place.”

As long as there are intermittent cold spells, and some sea ice, it appears the Arctic atmosphere will continue cleaning itself of mercury and other pollutants. According to Nghiem, although the average temperature of the Arctic is indeed rising, unseasonal cold spells have become more common over the last decade, and they are sufficient for beginning the bromine chain reaction. Yet he remains optimistic that their research can help convince governments to limit mercury pollution where possible. Nghiem said, “With the scientific foundation to show this is happening, I hope it will be the basis for making the right decisions, and even help to expedite the right decisions.”

References

Brodzik, M. J. and R. L. Armstrong. 2008, updated daily. Near-Real-Time DMSP SSM/I-SSMIS Pathfinder Daily EASE-Grid Brightness Temperatures. Boulder, Colorado USA: NASA DAAC at the National Snow and Ice Data Center (NSIDC).

Cavalieri, D., T. Markus, and J. Comiso. 2004, updated daily. AMSR-E/Aqua Daily L3 12.5 km Brightness Temperature, Sea Ice Concentration, & Snow Depth Polar Grids V002. Boulder, Colorado USA: NASA National Snow and Ice Data Center (NSIDC) DAAC.

Goddard Earth Sciences Data and Information Services Center (GES DISC). 2012. Aura OMI Level 3 Data Products. Greenbelt, Maryland USA.

NASA/Land, Atmosphere Near real-time Capability EOS (LANCE). 2012. MODIS Level 3 Sea Ice Extent, and Ice Surface Temperature. Greenbelt, Maryland USA.

NASA MODIS Level 1 and Atmosphere Archive and Distribution System (LAADS) DAAC. 2012. MODIS Level 2 Aerosol. Greenbelt, Maryland USA.

NASA Physical Oceanography DAAC (PO.DAAC). 2012. QuikSCAT Ku-band Backscatter. Pasadena, California USA.

Nghiem, S. V., P. B. Shepson, W. Simpson, D. K. Perovich, M. Sturm, et al. 2013. Arctic sea ice reduction and tropospheric chemical processes. Paper presented at the fourth International Conference on Bioenvironment, Biodiversity, and Renewable Energies, Lisbon.

Nghiem, S. V. , I. G. Rigor, A. Richter, J. P. Burrows, P. B. Shepson, et al. 2012. Field and satellite observations of the formation and distribution of Arctic atmospheric bromine above a rejuvenated sea ice cover. Journal of Geophysical Research 117: D00S05, doi:10.1029/2011JD016268.

Simpson, W. R., D. Carlson, G. Hoenninger, T. A. Douglas, M. Sturm, D. K. Perovich, and U. Platt. 2007. The dependence of Arctic tropospheric halogen chemistry on sea ice conditions. Atmospheric Chemistry and Physics 7: 621–627.

For more information

NASA Goddard Earth Sciences Data and Information Services Center (GES DISC)

NASA Land, Atmosphere Near real-time Capability for EOS (LANCE)

NASA Level 1 and Atmosphere Archive and Distribution System Distributed Active Archive Center (LAADS DAAC)

NASA National Snow and Ice Data Center DAAC (NSIDC DAAC)

NASA Physical Oceanography DAAC (PO.DAAC)

Implications of Arctic Sea Ice Reduction on Tropospheric Chemistry

About the remote sensing data used
Satellites Terra Terra, Aqua Aura
Sensors Moderate Resolution Imaging Spectroradiometer (MODIS) MODIS Ozone Monitoring Instrument (OMI)
Data sets MODIS Level 2 Aerosol MODIS Level-3 Sea Ice Extent, and Ice Surface Temperature OMI Level 3
Backscatter
Resolution 10 kilometer 4 kilometer 725 kilometer
Parameters Aerosol optical depth Sea ice extent, sea ice surface temperature Bromine, aerosol optical depth
DAACs NASA Level 1 and Atmosphere Archive and Distribution System Distributed Active Archive Center (LAADS DAAC) NASA Land, Atmosphere Near real-time Capability for EOS (LANCE) NASA Goddard Earth Sciences Data and Information Services Center (GES DISC)


About the remote sensing data used
Satellites Quick Scatterometer (QuikSCAT) Defense Meteorological Satellite Program (DMSP) F17 Aqua
Sensors SeaWinds Special Sensor Microwave Imager/Sounder (SSMIS) Advanced Microwave Scanning Radiometer - Earth Observing System (AMSR-E)
Data sets QuikSCAT Ku-band Backscatter Near-Real-Time Brightness Temperatures AMSR-E/Aqua Brightness Temperatures, Sea Ice Concentration, and Snow Depth
Resolution 25 kilometer 25 kilometer 6.25–25 kilometer
Parameters Sea ice extent, sea ice class distribution, melt on sea ice Brightness temperatures Brightness temperatures, sea ice concentration, snow depth
DAACs NASA Physical Oceanography DAAC (PO.DAAC) NASA National Snow and Ice Data Center DAAC (NSIDC DAAC) NASA NSIDC DAAC

The photograph in the title graphic was taken from aboard U.S. Coast Guard Cutter Healy (WAGB-20) and shows Arctic sea ice against the horizon (Courtesy NASA/ K. Hansen)
Last Updated