Science Objectives
Murry-Hudson and others (2015), in their paper "Remote sensing-derived hydroperiod as a predictor of floodplain vegetation composition" published in Wetlands Ecology and Management, monitored the Okavango Delta wetland in Botswana to establish a history of flooding in the area and understand how it relates to potential ecological changes.
Instruments Used
The team used Terra’ MODIS Surface Reflectance product (MOD09Q1). The authors started monitoring the area with satellite imagery from 1989. They considered MODIS to be an excellent choice for its monitoring potential to generate near-real time flood extent maps in the Okavango Delta wetland system.
Major Findings
In the study, two imagery time series of flooded areas are created. The first uses Landsat data from 1989 to 2007. MODIS Surface Reflectance data are used to fill in the missing information from the years 1991, 2003, and 2004. The second time series consists of 89 8-day 250 meter surface reflectance images (MOD09Q1) images collected from 2000 to 2007, which were obtained from the LP DAAC Data Pool. The authors stacked these MODIS images to create a flood duration map of the Okavango delta for each water year. The MODIS data were validated with in-situ community vegetation data and Landsat data.
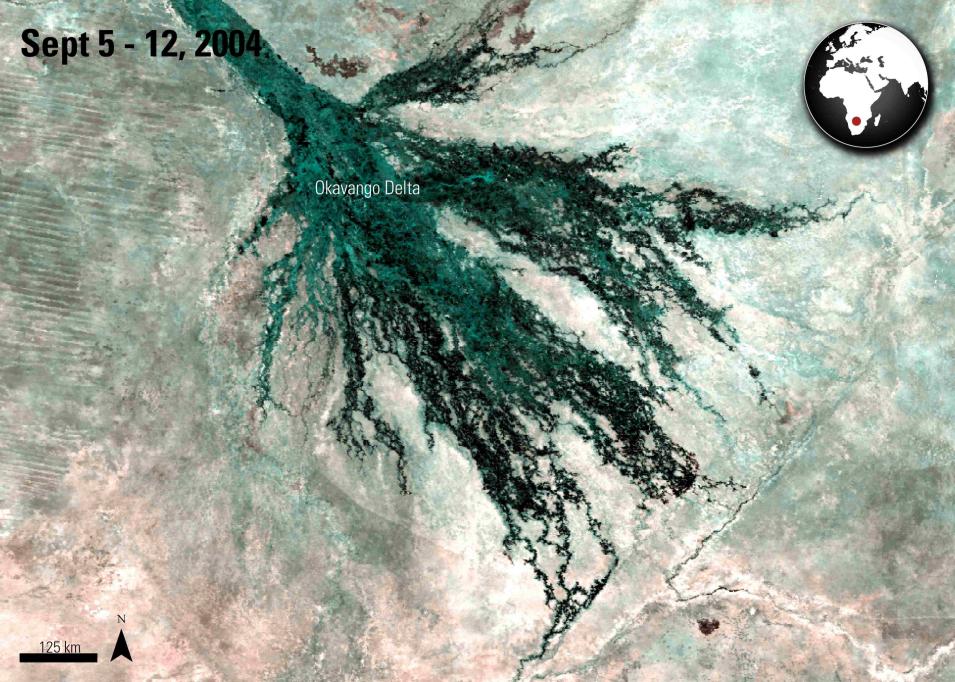
The authors found that recurring flooding in the area varies between 2,000 and 3,600 square kilometers (~772 and 1,390 square miles), with maximum flooding reaching 7,200 square kilometers (~2,780 square miles) in 2006. In the time series, it was evident that peak flooding occurred during the months of August and September. The authors were able to examine differences in types of floods and the duration of inundation in the Delta. They were also able to distinguish between low-amplitude short-duration flooding, which occurred in 2003, and a larger and longer flooding, as seen in the image to the left from 2004. Both of these floods caused parts of the delta to be inundated for the entire year and other areas of the delta that are typically dry were inundated for half of the year. The authors then used this data in combination with in-situ measurements, to identify what type of vegetation is in the areas and how they relate to frequencies and durations of floods. They found that the maps created from MODIS Surface Reflectance Band 1 (MOD09Q1) produced flood maps with 89 percent or greater accuracy, as compared to field data and Landsat imagery. The authors have initiated a long-term monitoring program at the Okavango Research Institute to compare flooding extents and to identify classes of floodplain vegetation using MODIS data.
References
Publication Reference
Murry-Hudson, M., Wolski, P., Cassidy, L., Brown, M., Thito, K., Kashe, K., and Mosimanyana, E., 2015, Remote sensing-derived hydroperiod as a predictor of floodplain vegetation composition: Wetlands Ecology and Management, v. 23, p. 603–616. doi:10.1007/s11273-014-9340-z
Image References
Granule IDs
- MOD09Q1.A2004249.h20v10.005.2007313190837
- MOD09Q1.A2004249.h20v11.005.2007313195105


