Data Chat: NASA Data Help the U.S. Navy Forecast Tropical Cyclones

Data from NASA’s Land, Atmosphere Near real-time Capability for Earth observations (LANCE) are critical to the Navy’s tropical cyclone forecasts.
Joseph M. Smith
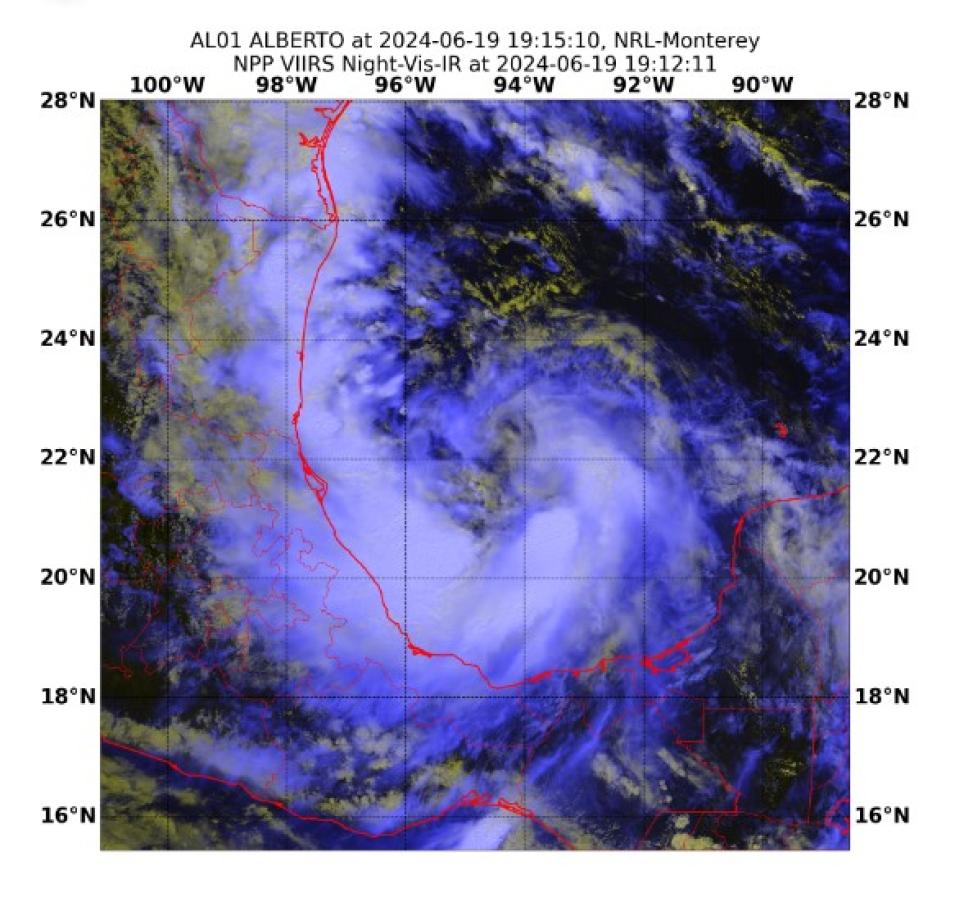
Image
This nighttime visible image created with data from the Visible Infrared Imaging Radiometer Suite (VIIRS) aboard the joint NASA/NOAA Suomi National Polar orbiting Partnership (Suomi NPP) satellite shows Tropical Storm Alberto in the Gulf of Mexico on June 20, 2024. Credit: NRL.

For the U.S. Navy, which has thousands of personnel aboard ships at sea at any given time and installations in coastal areas around the world, knowing the location of tropical cyclones, the direction in which they’re headed, and whether they are strengthening or waning is critical. So too is monitoring the atmospheric and oceanic conditions that lead to the development of severe storms. Therefore, it should come as no surprise that the Navy has both a meteorological organization—the Naval Meteorology an Oceanography Command (NMOC), which provides worldwide meteorology and oceanography support to U.S. and coalition forces—and a marine meteorology research agency devoted to studying the atmospheric processes that impact fleet operations.

That agency is the Marine Meteorology Division of the U.S. Naval Research Laboratory (NRL), and among its areas of research is enhancing the prediction and forecasting of tropical cyclones through the assimilation of satellite data from new missions and the development of new data products from existing data streams.  

In the following interview, Mindy Surratt, a researcher with the Marine Meteorology Division, and her NRL colleagues, researcher Charles Sampson and meteorologist Chris Camacho, discuss how access to satellite data from a variety of platforms and instruments, collaboration with members of the data-user community, and low-latency observations from NASA’s Land, Atmosphere Near real-time Capability for Earth observations (LANCE) benefit their work.

According to its website, the Marine Meteorology Division conducts basic applied research designed to improve scientific understanding of atmospheric processes that impact fleet operations. Can you elaborate on that? What atmospheric processes are you studying?

Surratt: The NRL facility in Monterey, California, focuses on weather prediction and forecasting—specifically on how weather may affect naval assets. One of the specific things we do is develop guidance to support tropical cyclone forecast efforts, and our main operational partner for that is the Joint Typhoon Warning Center (JTWC, a joint Air Force and Navy command) in Pearl Harbor, Hawaii. We also work with NOAA’s National and Central Pacific Hurricane Centers. Adding all of their areas of responsibility together, we have global U.S. tropical cyclone forecasting coverage.

Our products are developed specifically to meet JTWC requirements, but they are also heavily used by the two NOAA centers. Clearly, forecasting is very important for the Navy because tropical cyclones and severe storms are going to affect ships at sea and bases in the littoral areas that frequently experience tropical cyclone events.

Given the lack of aircraft reconnaissance in JTWC’s area of responsibility (from the International Dateline to Africa in the Northern Hemisphere and the entire Southern Hemisphere), JTWC relies almost exclusively on a suite of satellite platforms from different countries and agencies that provide global coverage of tropical cyclones, especially in data-void regions. This suite of satellites is a combination of geostationary and polar-orbiting satellites, each of which has its own strengths and weaknesses. For example, even though geostationary sensors provide global coverage at high temporal resolution, their wavelengths are currently unable to provide the same level of detail available from sensors aboard polar orbiters. Microwave imagers, synthetic aperture radar (SAR) instruments, and scatterometers aboard polar orbiting satellites are critical for helping us better understand internal storm structure, low level wind speeds, and ocean surface wind vectors. When taken together, these satellites provide rapid refresh of tropical cyclone detection in these data-void regions. 

How do the forecasts generated by the NRL complement or supplement the meteorological information you receive from NOAA and other agencies or entities around the world?

Sampson: In the U.S., we've got an agreement that specifies who does what and where, so [there is] something of a divide and conquer approach to tropical cyclone forecasting. The National Hurricane Center covers the Atlantic, the Central Pacific Hurricane Center covers the Central Pacific, and the JTWC covers the Western Pacific, Indian Ocean, and the entire Southern Hemisphere. When you add them together, you get global coverage for tropical cyclones.

Surratt: We get data from agencies around the world, so we're integrating information from NASA, NOAA, the U.S. Air Force, the U.S. Space Force, [and] our partner space agencies in Europe. We're integrating all this information, processing it, and disseminating it to the U.S. hurricane and tropical cyclone centers through the Automated Tropical Cyclone Forecast System (ATCF). We also provide information publicly to other centers around the world through our public-facing tropical cyclone website (TCWeb). We're pulling in information from many different agencies and disseminating it to many different agencies, so it's a very collaborative effort.

How often are tropical cyclone forecasts issued?

Sampson: Tropical cyclone forecasts are issued in six-hour intervals; for the tropical cyclone forecasters, if you can get super low-latency data (e.g., every 15 minutes as opposed to 3 hours), they'll take it. Such timely data could be very important because they're trying to do an analysis right there on the spot and so data that are three hours old is less useful than data from 10 minutes ago.

How do NASA Earth science data, particularly the data that you get from NASA’s LANCE, support the NRL’s forecasts?

Surratt: One of the most important datasets we get from LANCE for [tropical cyclone] forecasting is from the Visible Infrared Imaging Radiometer Suite’s (VIIRS) Day/Night Band. It is a critical product that provides consistent imagery both day and night, and it gives a better view of storm structure at night than is currently available from other sources.
Image
This series of images shows Hurricane Andres in the eastern Pacific during May 31 to June 4, 2015, using the Day/Night Band + infrared red-green-blue (RGB) composites. The white-cyan-colored areas indicate mid- to upper-level convective clouds and the yellow areas indicate lower-level stratus clouds. Credit: NRL.

Camacho: To provide some ballpark numbers on how much we rely on LANCE datasets for visible and infrared imagery, we pull down roughly 160 gigabytes per day of data from the Moderate Resolution Imaging Spectroradiometer (MODIS) aboard NASA’s Terra and Aqua satellites, and about 420 gigabytes of data per day from VIIRS. The amount of VIIRS data we download on a daily basis is greater because of the higher native resolution of the data and because we're pulling [the data] from three platforms—the joint NASA/NOAA Suomi National Polar-orbiting Partnership (Suomi NPP) and the Joint Polar Satellite System (JPSS) NOAA-20 and -21 satellites.

Surratt: The VIIRS Day/Night Band also is a primary resource used in developing the ProxyVis product, a geostationary-based proxy nighttime visible imagery product developed by Colorado State University’s Cooperative Institute for Research in the Atmosphere (CIRA). ProxyVis is heavily used by JTWC, the National Hurricane Center, and the Central Pacific Hurricane Center, as well as by NOAA’s Ocean Prediction Center and Weather Prediction Center.

Among the other datasets we use for tropical cyclone forecasting purposes are those from the Compact Ocean Wind Vector Radiometer (COWVR) and the Temporal Experiment for Storms and Tropical Systems (TEMPEST) instruments on the International Space Station, and those from the new Time-Resolved Observations of Precipitation structure and storm Intensity with a Constellation of Smallsats (TROPICS) mission. We get passes a few times a day and they give us a sense of a storm’s structure. We also use data from the Soil Moisture Active Passive (SMAP) mission, which gives us low resolution wind speeds in tropical cyclones, which are unaffected by rain due to [the SMAP radiometer's] longer wavelength. The Advanced Technology Microwave Sounder instrument (ATMS) provides information about the physical properties of the atmosphere, such as temperature and moisture, which heavily influence weather patterns. The Global Precipitation Measurement (GPM) mission gives us rain rates. So, there are a number of NASA Earth science datasets that we use, and JTWC has been relying increasingly on COWVR, TEMPEST, and TROPICS as some of the current passive microwave sensors are reaching end of life.

It's very important to get data from these new Pathfinder missions, and we are always interested in getting new datasets to potentially fill any gaps in temporal coverage. Polar orbiters revisit only twice a day, so the more data types we have, the better coverage we can get over tropical cyclones in general. We are always interested in processing and evaluating new datasets from any new pathfinder missions.

How are the data from these sensors being used? Are the data all getting funneled into weather models?

Surratt: For tropical cyclone forecasting, we pull the datasets from these various sources and then process them with the Geolocated Information Processing System (GeoIPS). GeoIPS is a collaborative development platform for processing weather satellite and forecast data that interprets the data and allows us to generate the different products that we need, such as imagery, or transfer the data into other formats that we can then disseminate to our partners.

We produce both METOC TIFF images, which get fed into the ATCF that the National Hurricane Center, Central Pacific Hurricane Center, and JTWC use to generate their forecast products. We also produce PNG imagery products that are displayed on TCweb. Anyone can visit the website and see the imagery there.

GeoIPS is a collaborative platform accessible in GitHub. How is it used within the larger tropical cyclone forecasting community?

Surratt: GeoIPS is an NRL-developed open-source infrastructure that was created specifically to streamline transitions of new products and capabilities from our community partners like universities and other labs. For example, the ProxyVis product mentioned earlier is a GeoIPS transition from Colorado State University.

Essentially, GeoIPS was developed to make it easier for people to share capabilities and new functionality and information. It gives us a consolidated research and development platform and it's available on GitHub, so we have a public open-source project that people can contribute to. This repository holds the base infrastructure that allows other collaborators to develop new products for specific purposes as GeoIPS plugins. The modular nature of GeoIPS allows rapid integration of these new capabilities across the weather community.

We have a regular, open-source release cycle where we’ll develop a capability internally, put it through our internal public release cycle, and then make it available on GitHub. We then gather feedback from the community and integrate it within our internal development environment. The community that contributes to GeoIPS is pretty active, so if collaborators develop new tropical cyclone products they can contribute to those directly through GitHub and we can quickly integrate and demonstrate [these products] at NRL. It's proven to be a successful system for getting new capabilities integrated into the Navy.

How are members of the community contributing to the development of these new capabilities?

Surratt: We see a range of contributions from our external collaborators. Some external collaborators, like CIRA, enhance the core infrastructure code of GeoIPS itself. They contribute directly to GitHub with improvements to the core functionality of the main GeoIPS code base. Other external collaborations help improve the visualization of existing products within GeoIPS. For example, collaborators from the Massachusetts Institute of Technology Lincoln Laboratory improved the backend interpolation for TROPICS products, which produced a cleaner final product with less artifacts. We also have other university collaborators, such as the University of Wisconsin's Cooperative Institute for Meteorological Satellite Studies (CIMSS), who are in the process of implementing their tropical cyclone products as new GeoIPS plugins.

In sum, how would you characterize the value of NASA Earth science data, be it from LANCE or another source, to the Marine Meteorology Division?

Surratt: Having a wide variety of satellite data is critical to weather forecasting, both for numerical weather prediction (NWP) models as well as tropical cyclone forecasts. It’s very important to have NASA Earth science data along with all of our other capabilities because it allows us to provide an extensive suite of products to the forecasters. The quality of the forecast is only going to be as good as the information fed into it, so without data providers like NASA LANCE, we wouldn’t be able to provide the high-quality forecast guidance that we do now.

Camacho: And it’s not just the information provided by the data, but also the timeliness of data. The low latency data that LANCE provides are really critical, because if you have data arriving late and are not included in the data assimilation process for an NWP run, for instance, then your forecast may not be as accurate as it could be had all the data arrived in time.

Surratt: The same is true for tropical cyclone forecasting. There is a cycle for tropical cyclone forecasts, and if you don't have the data, then you can’t generate the images in time. So, it's very important to have timely, low-latency data.

Sampson: The data are important even if you have them a year later, but [the data are] most important immediately. We'll take them no matter what latency [they have], because even in post-storm analysis, all those data are used, especially if [the data are] high quality. If you removed all the NASA platforms from the suite of data we use for tropical cyclone forecasting, you wouldn’t have happy forecasters because there would be huge gaps in depictions of wind fields and visible infrared, and ProxyVis. That's the thing that really makes a difference—having a constant flow of observations over tropical cyclones.

Learning Resources

In the following publication, Surratt and her colleagues detail the ways in which critical information about tropical cyclone structure, location, intensity changes, shear environment, lightning, and other characteristics can be extracted when the VIIRS Day/Night Band data are used in isolation or in a multichannel approach with coincident infrared channels.

Hawkins, J.D., Solbrig, J.E., Miller, S.D., Surratt, M., Lee. T.F., Bankert, R.L., & Richardson, K. (2017). Tropical Cyclone Characterization via Nocturnal Low-Light Visible Illumination. Bulletin of the American Meteorological Society, 98, 2351-2365. doi:10.1175/BAMS-D-16-0281.1

Last Updated